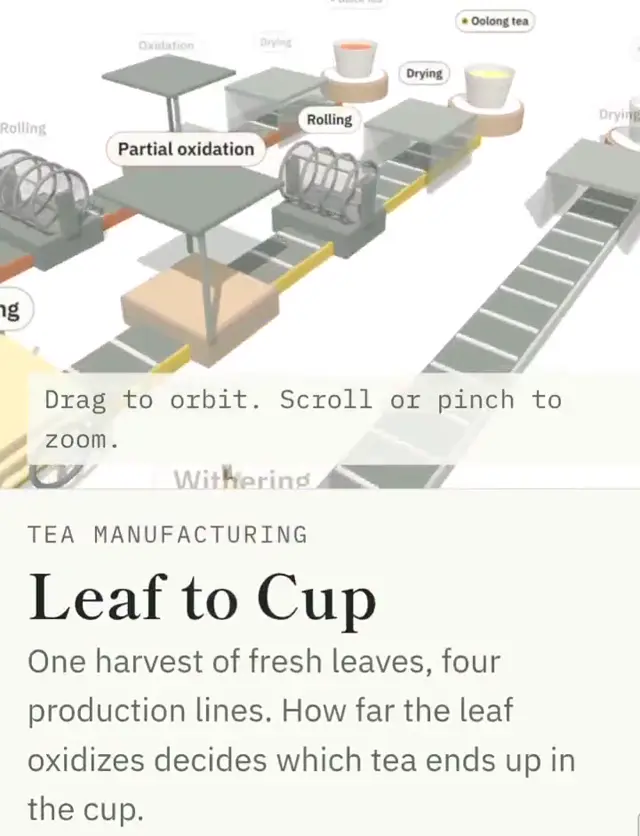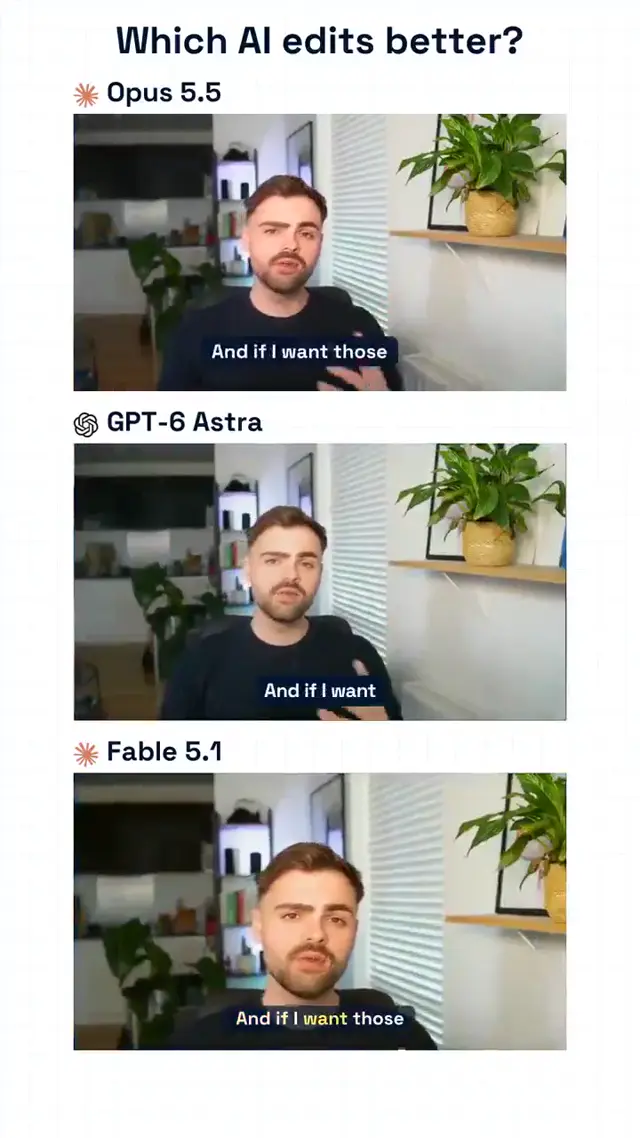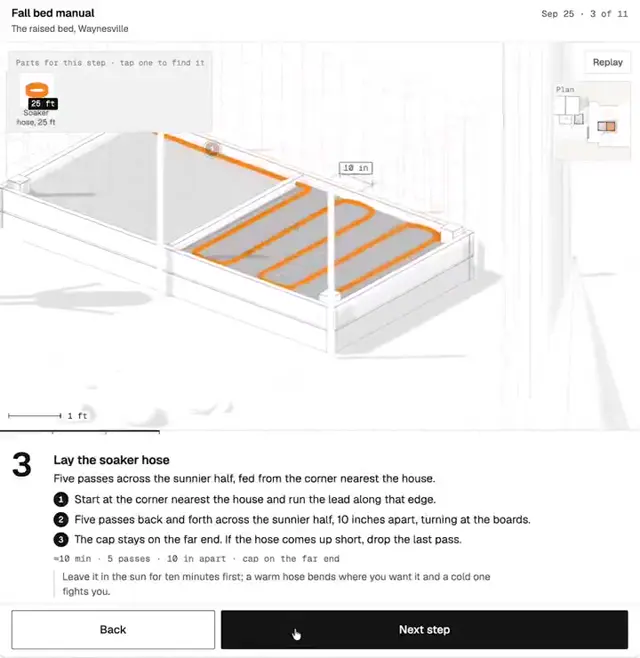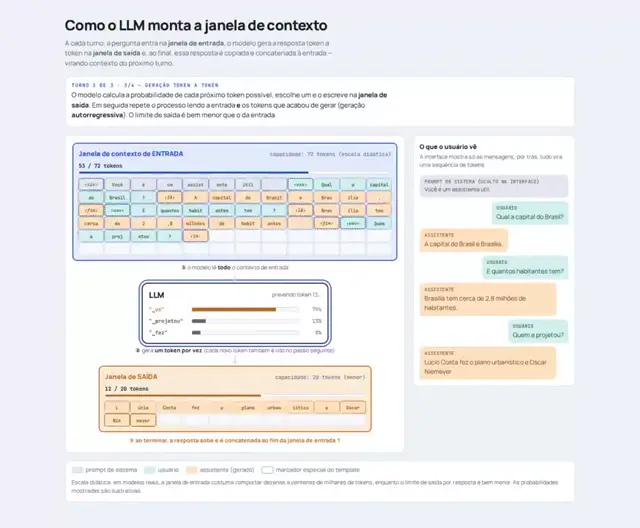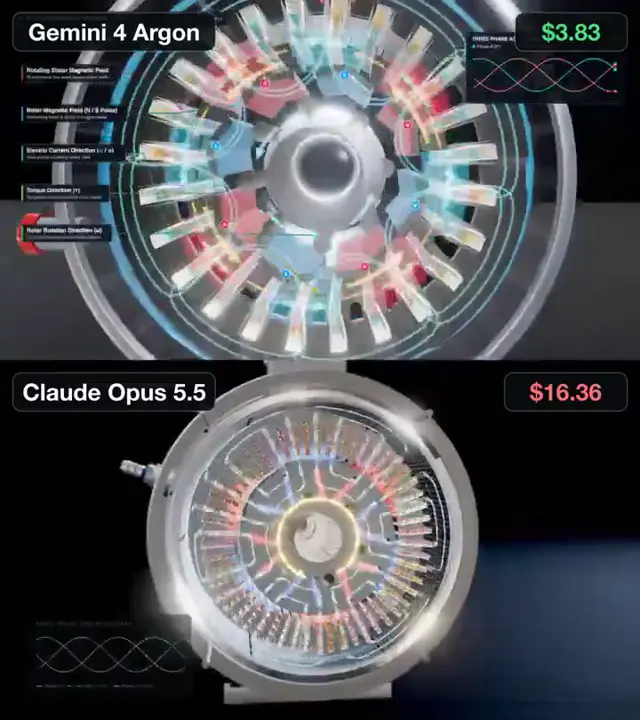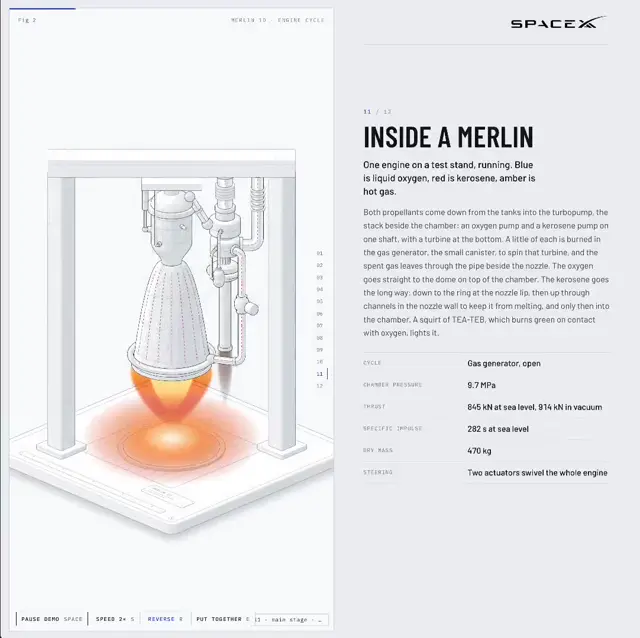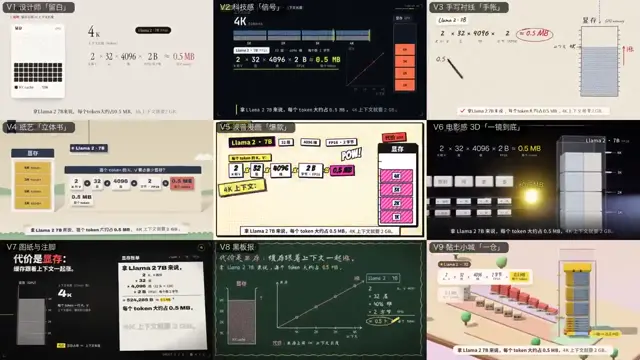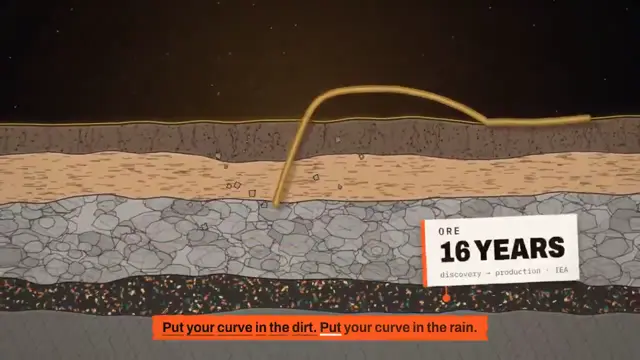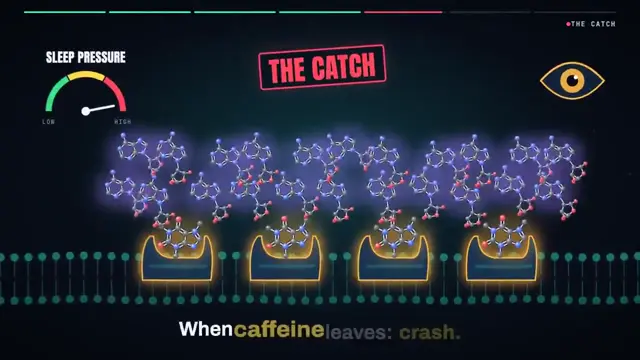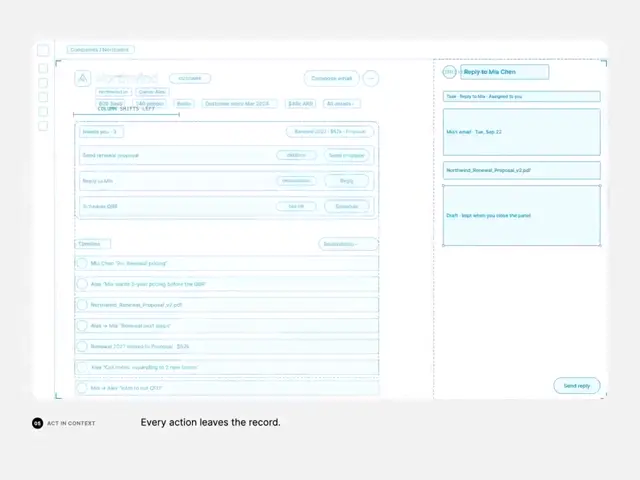
Explain another technical system with a compact component diagram, then separate its safeguards into individually labeled visual examples. Reuse a small accent palette across comparison charts and code callouts. End with a concise limitations panel that distinguishes measured improvements from broader claims.
No creator prompt published. Reference wrote this brief. Copy for agent includes the brief, visual reference links, and setup guidance.
Rules for agent self-improvement
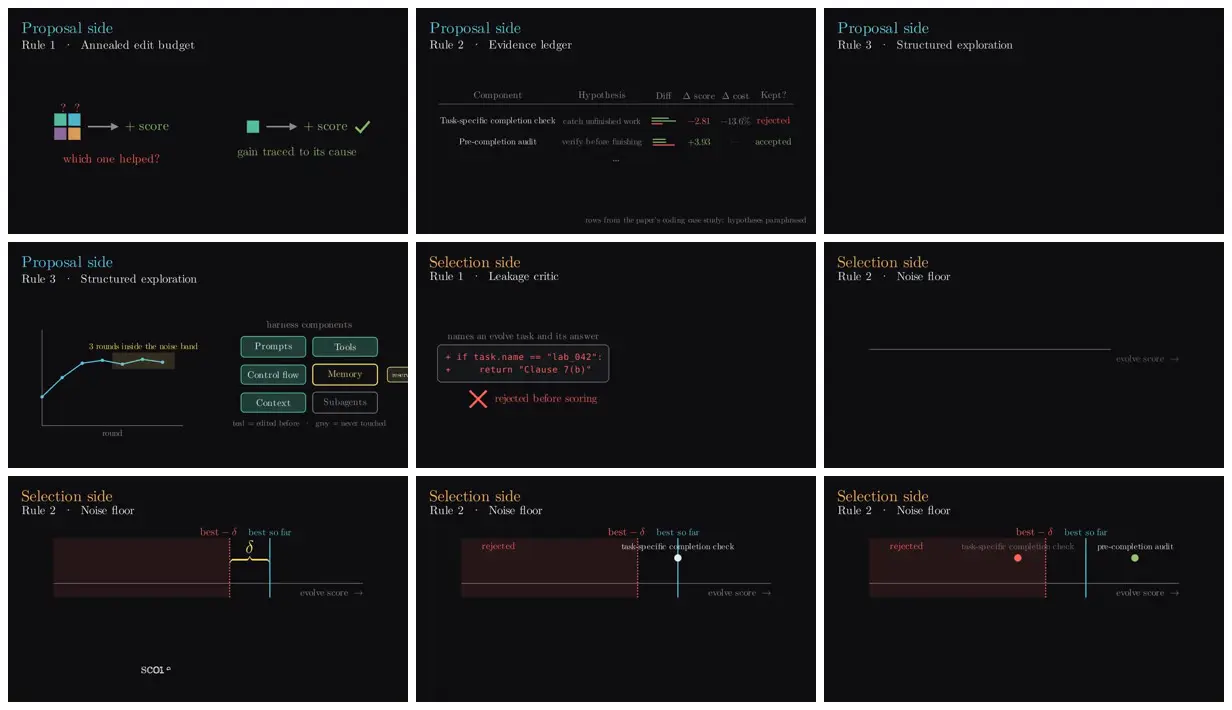
A research explainer presents agent harness components, edit-budget and selection rules, benchmark comparisons, token costs, and methodological caveats using sparse diagrams and charts on black.
How it was made
Reference shows a muted excerpt from 3:34 to 5:04. Watch the complete video at the original source.
Opus 5.5
Source and credit
X · Sep 24, 2026 · 5.6k likes · 334k views · 176 comments
Made with AI, according to the source
Look notesby Reference
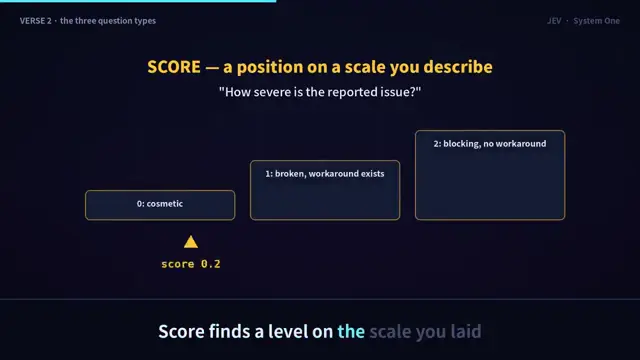
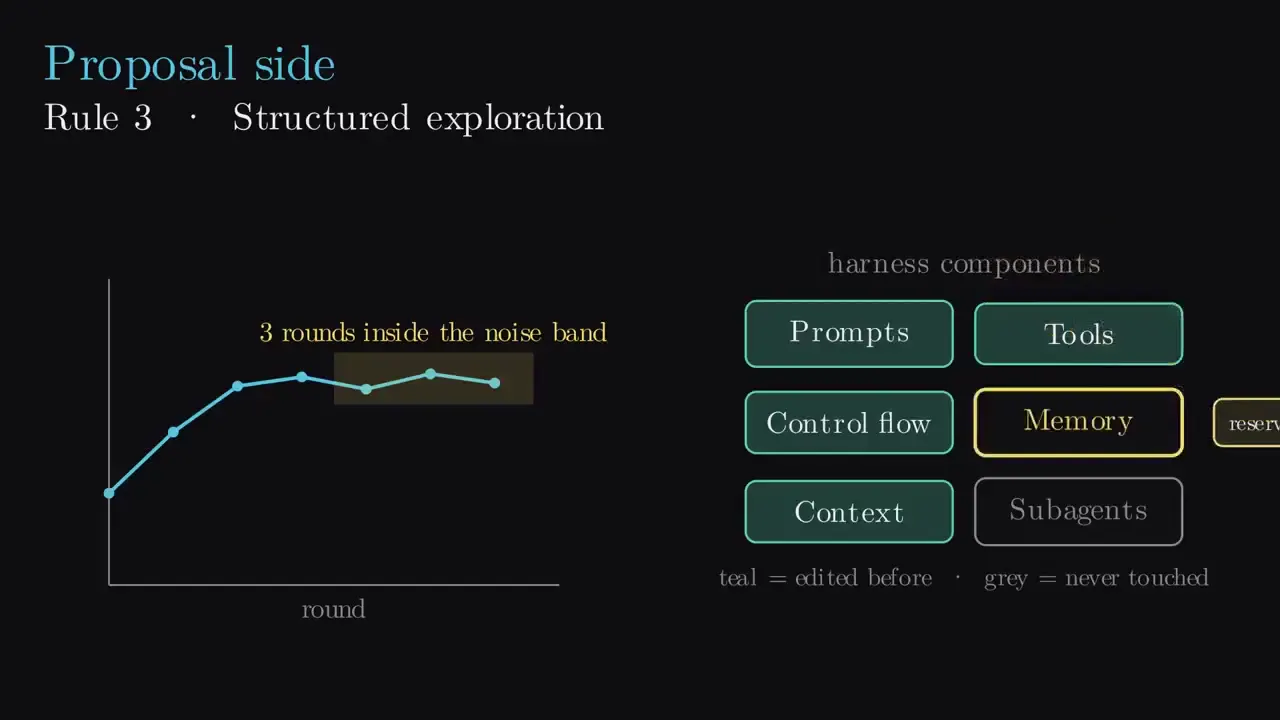
A restrained, technical presentation about proposal and selection rules, using small diagrams and concise labels to explain scoring, evidence, and thresholds.
- Color
- Near-black backgrounds with muted teal, cyan, green, red, gold, and gray accents.
- Type
- Small serif headings and labels, paired with compact monospaced code text.
- Framing
- Sparse layouts with generous dark negative space; visual elements are arranged around simple charts, tables, and diagram annotations.
- Structure
- Slides use rule-number headings. Proposal-side slides show scoring concepts, an evidence ledger, and a threshold chart; selection-side slides show a code-based rejection example and score-floor diagrams with marked candidates.