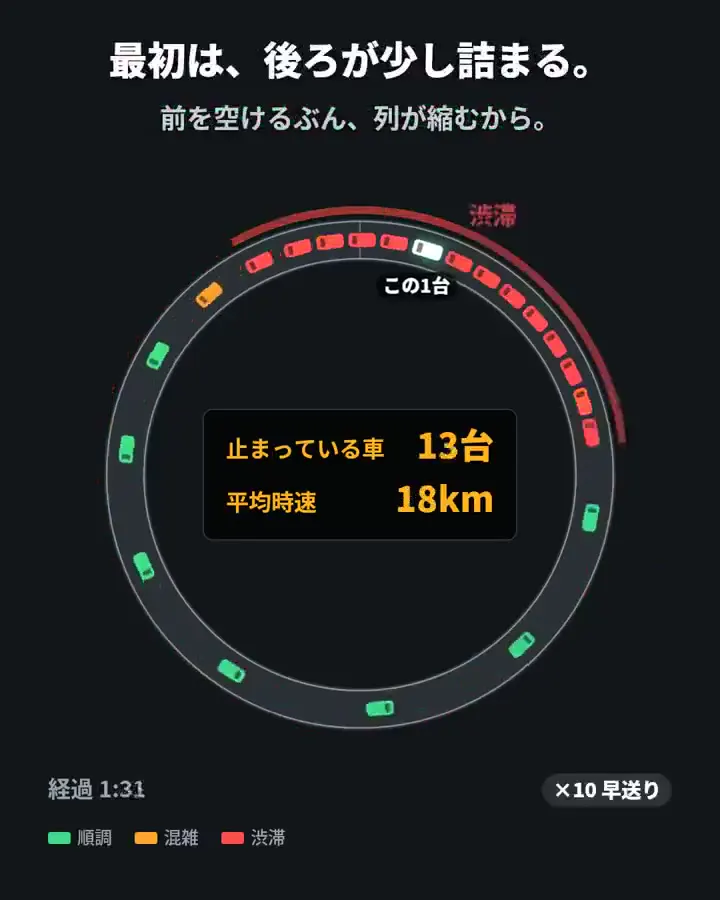
Frame from Traffic jams on a circular road

Traffic jams on a circular road

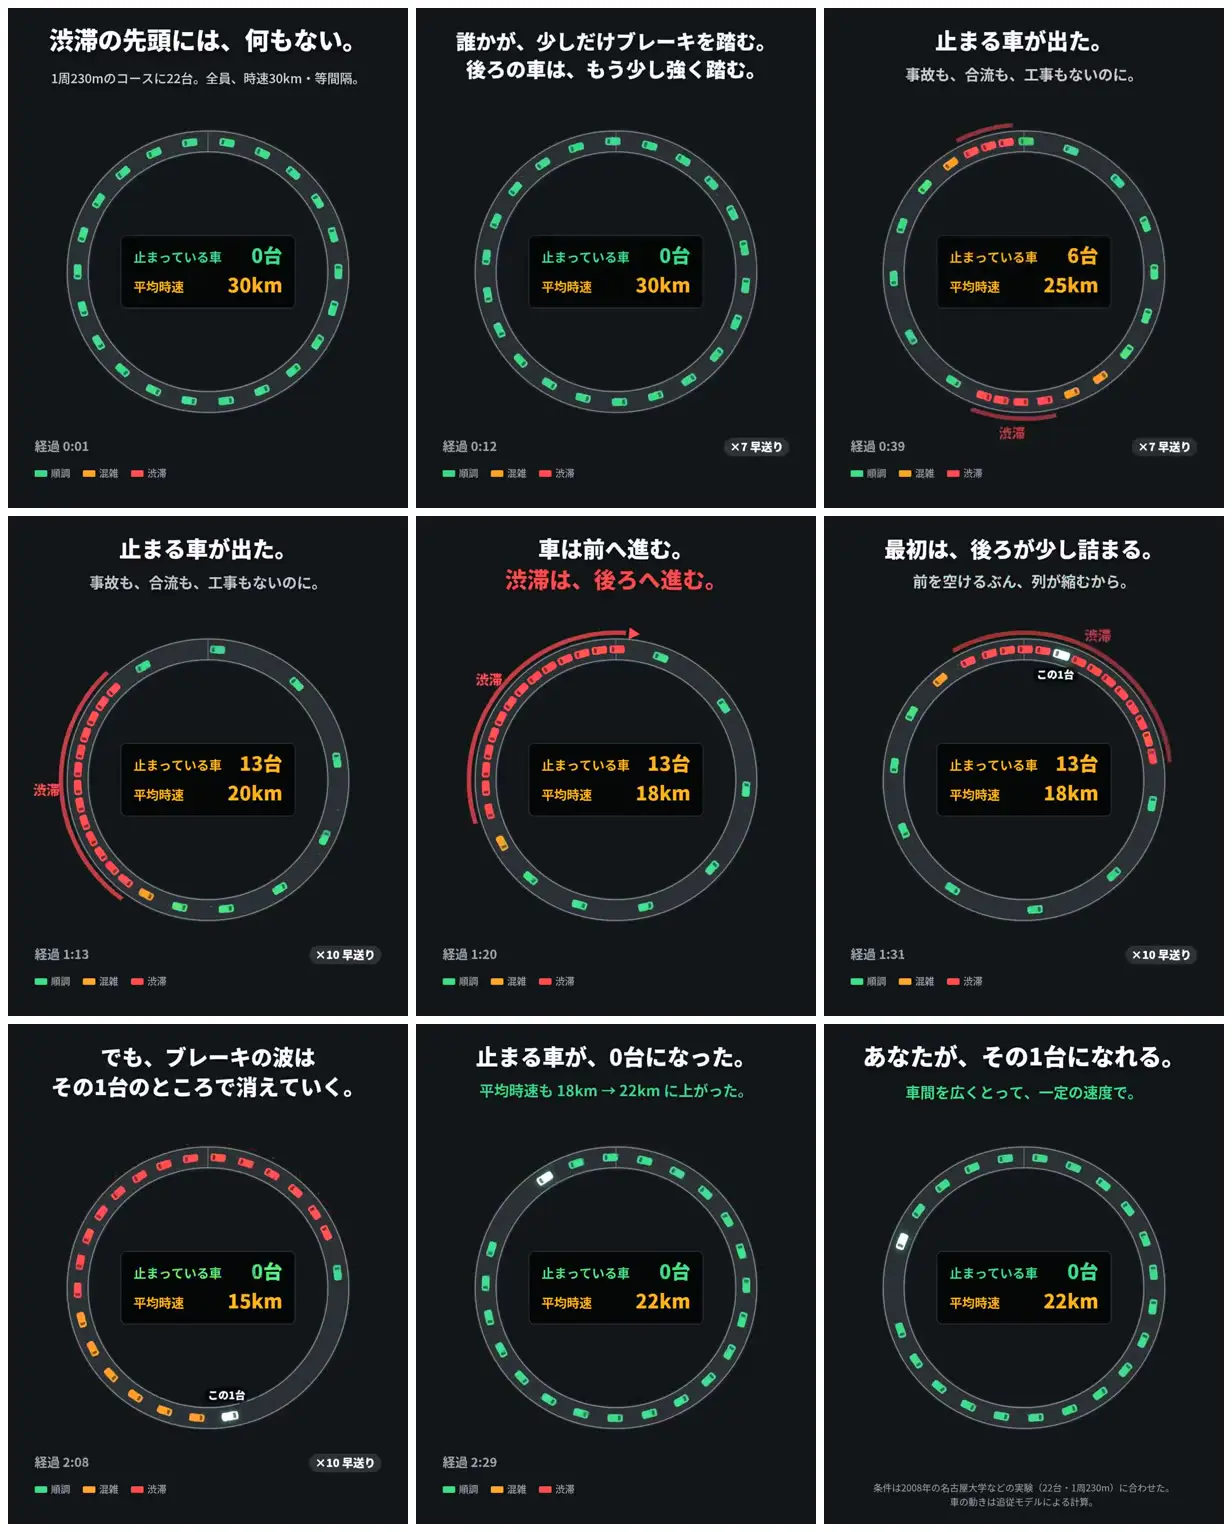
A Japanese-language explainer uses a circular road, color-coded cars and numerical readouts to show how small braking disturbances create traffic jams and how one driver's wider spacing can help resolve them.

Recreation briefby Reference

Use a closed-loop diagram to explain another system in which local decisions create collective bottlenecks, such as a production line or service queue. Keep the layout stable, assign consistent colors to system states, and pair each stage with two simple metrics. Highlight one participant in white to make the proposed intervention concrete.

No creator prompt published. Reference wrote this brief. Copy for agent includes the brief, visual reference links, and setup guidance.

Recreation challengeMake your own version and share the prompt.

Found the creator’s prompt? Share its source.

How it was made

Opus 5.5

Source and credit

X · Oct 2, 2026 · 2k likes · 255k views · 40 comments

Made with AI, according to the source

Discovery collection

Look notesby Reference

A clean infographic uses a circular road and colored cars to illustrate traffic flow, congestion waves, and recovery.

Color
Near-black backgrounds and charcoal roads, with green, amber, red, and occasional white cars and labels.
Type
Bold white Japanese headings, smaller gray supporting text, and bright color-coded labels and statistics.
Framing
Each graphic centers a large ring-shaped road around a compact dashboard showing stopped-car count and average speed; explanatory text sits above and small legends below.
Structure
A sequence of labeled diagrams progresses from smooth traffic to braking, a spreading jam, and traffic returning to normal, with changing car colors and dashboard values.
Attempts

No attempts yet. Be the first: recreate this reference and send your result with the prompt that made it.

More like this

1:30

Rules for agent self-improvement

Recreation brief

Opus 5.5

1:15

Four tea production lines

Full prompt

Opus 5.5

1:41

LLM context windows and token grids

Full prompt

Opus 5.5

0:29

Bridge scans to structural drawings

Recreation brief

Opus 5.5 · Blender

0:49

Three edits of one talking-head video

Recreation brief

Opus 5.5

1:30

From noise to a cat on the moon

Full prompt

Opus 5.5

0:41

Raised-bed irrigation assembly guide

Partial prompt

Opus 5.5

1:30

Jev decision cards and flow diagrams

Full prompt

Opus 5.5

0:10

Circles, grids and shared value

Recreation brief

Ordinary Folk

2:03

Human identity through nodes and lines

Recreation brief

Animade

0:40

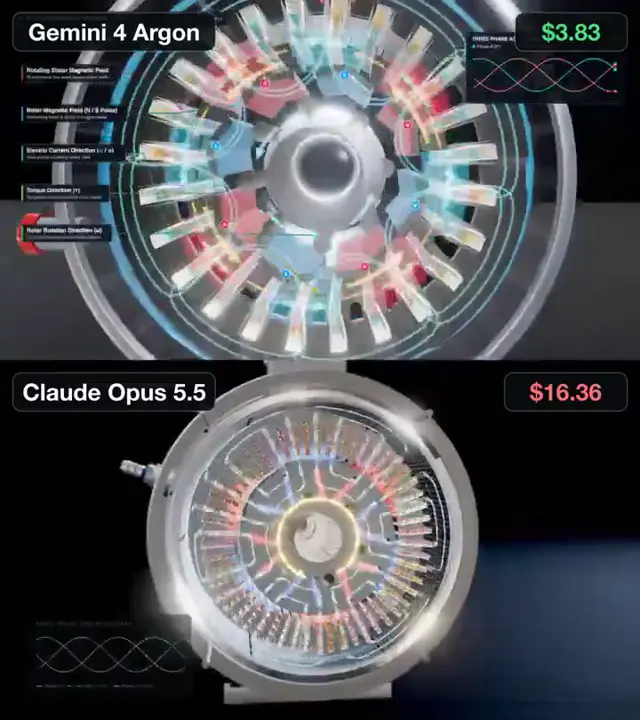
Electric motor cutaways and field diagrams

Full prompt

0:43

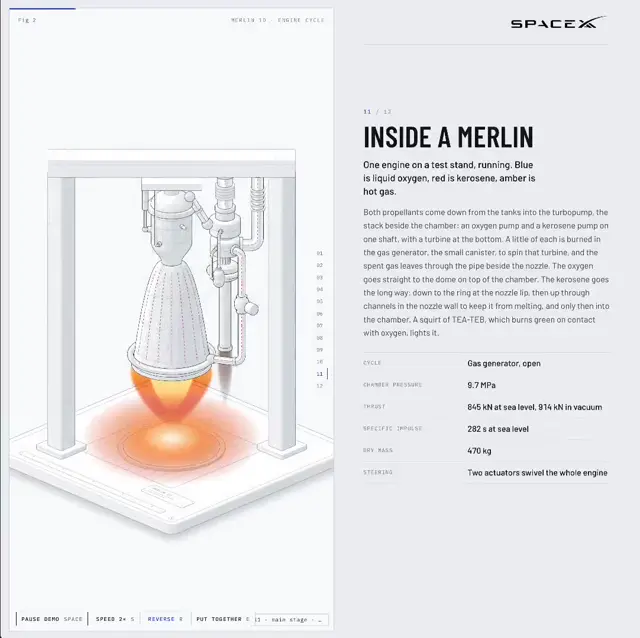
Rocket anatomy in pale wireframes

Recreation brief

Opus 5.5 · WebGL

1:30

Ancient settlements and farming maps

Recreation brief

Kurzgesagt – In a Nutshell

0:46

Basketball pick-and-roll breakdown

Recreation brief

Opus

0:45

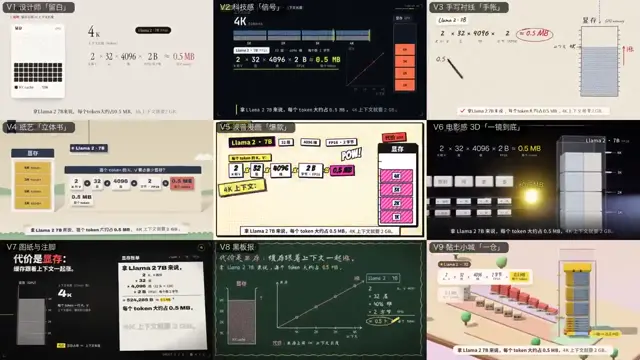
KV cache in nine visual styles

Prompt described

Opus 5.5

1:30

Sticker avatar explains an AI workflow

Recreation brief

Claude Code

1:30

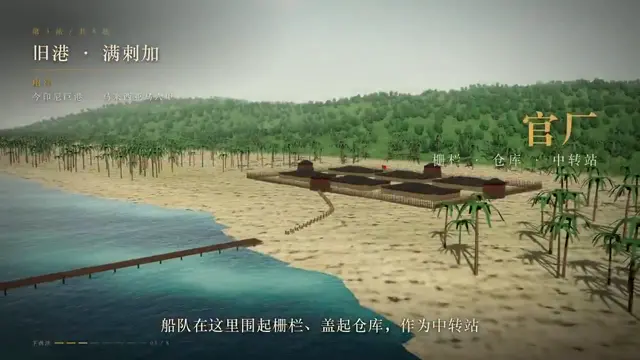
Zheng He’s fleet and voyage maps

Full prompt

Opus 5.5 Extra

1:30

Takeoff charts and newspaper corrections

Recreation brief

Claude

0:59

Orange robots illustrate effort levels

Recreation brief

Opus 5.5

0:30

A banknote explains inflation

Full prompt

Opus 5.5

1:30

Parenting as roots and scaffolding

Full prompt

Opus 5.5

0:15

Coffee and the sleep-pressure lock

Full prompt

Claude Code · Remotion

0:42

CRM redesign with blueprint overlays

Recreation brief

Opus 5.5

1:30

French theory in archival diagrams

Recreation brief

Opus 5.5

1:30

A city AI hides incident reports

Recreation brief

Opus 5.5

1:30

Attention diagrams with bilingual lyrics

Full prompt

Opus 5.5

1:30

Bitcoin history in orange and black

Full prompt

Opus 5.5 · PostgreSQL

1:30

Morocco’s political history in panels

Partial prompt

1:30

Anthropic history in ivory and coral

Full prompt

Opus 5.5

1:30

India’s history in type and symbols

Recreation brief

@HindolSengupta