please read claude md and memory indexes in bitcoin-analytics (my giant bitcoin data stack)

make me a 2-3 minute video about the history of bitcoin. rely on our bitcoin data in the postgres for key dates, prices, events, hacks, attribution, etc

use an original score using instruments from logic and garageband. line up the score to the events in the scenes

brand as @intangiblecoins and use our colors. let me know if you have any questions or need any decisions from me
Make it hereFree runs soon
Bitcoin history in orange and black
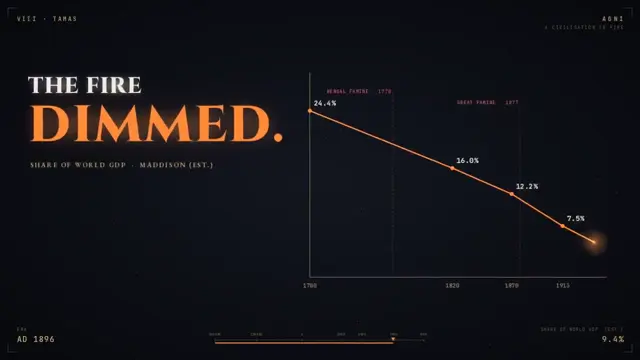
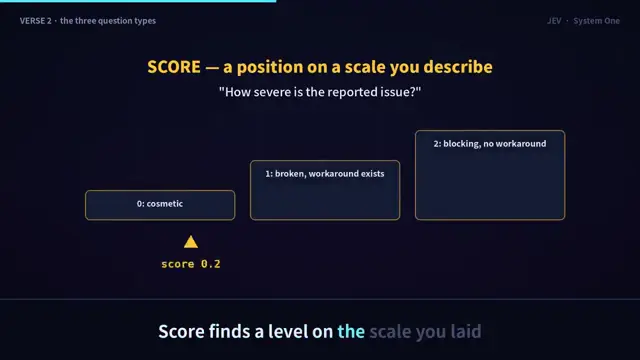
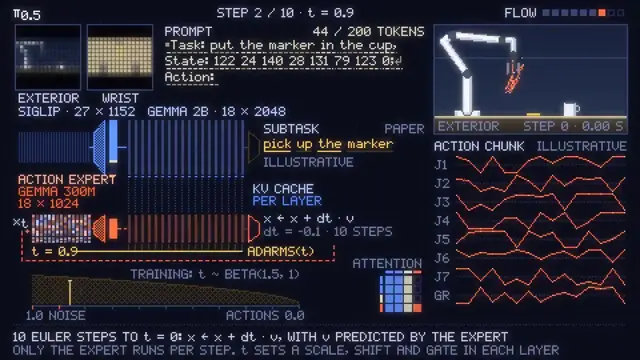
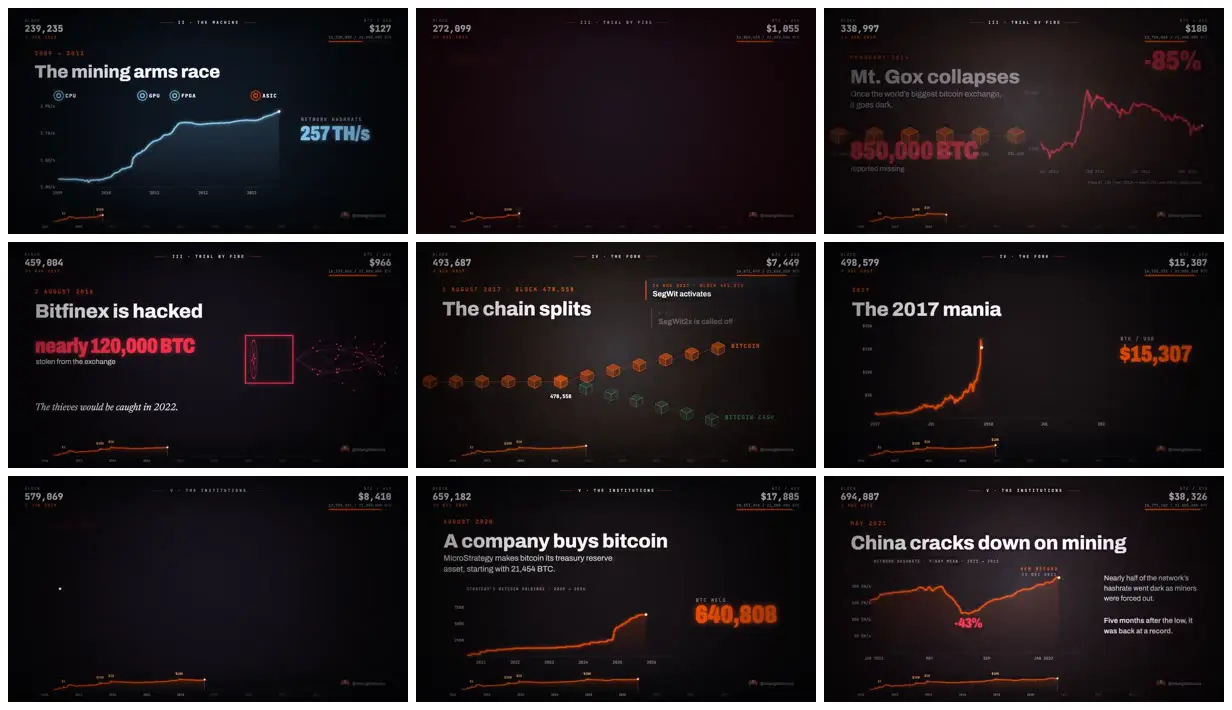
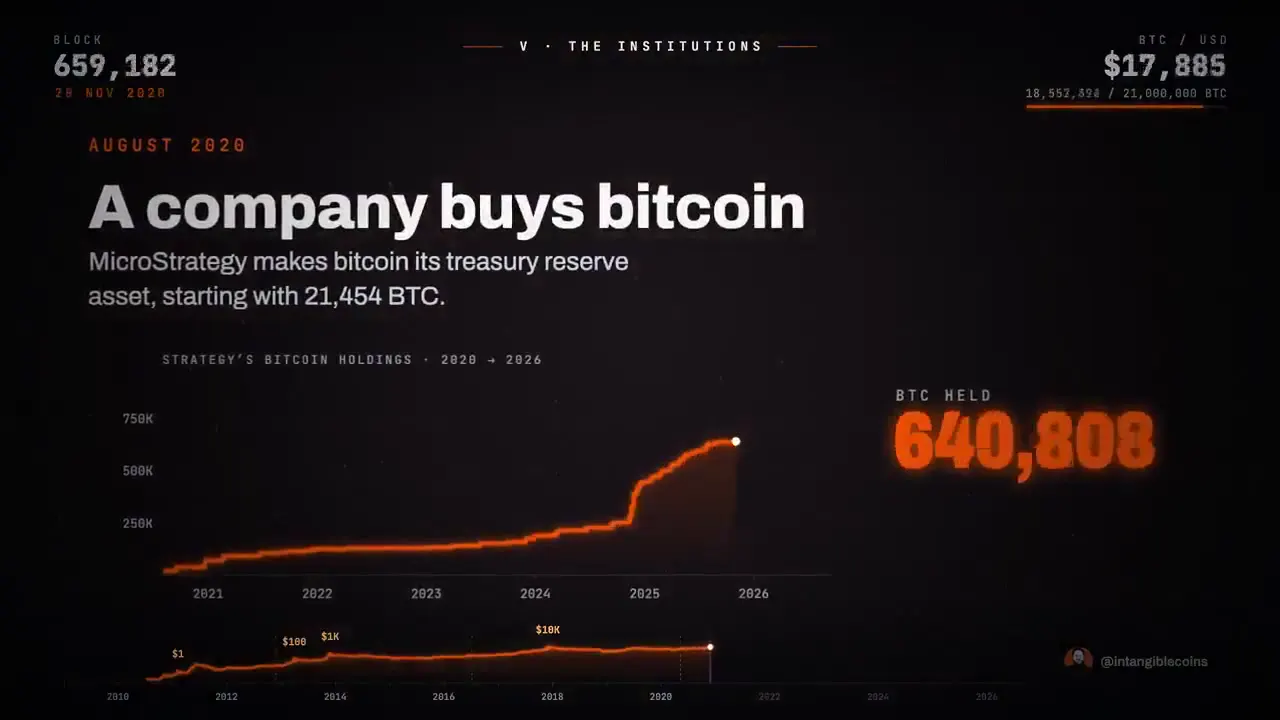
A chronological bitcoin explainer pairs bold event headlines with price traces, mining data, a chain-split diagram and halving charts, all within a consistent dark dashboard-style layout.
How it was made
Reference shows a muted excerpt from 1:02 to 2:32. Watch the complete video at the original source.
Claude Opus 5.5 · PostgreSQL
Source and credit
X · Sep 26, 2026 · 943 likes · 100k views · 43 comments
Made with AI, according to the source
Published instructions: https://x.com/intangiblecoins/status/2104255742656283040
Look notesby Reference
A dark, data-driven visual history of Bitcoin, featuring mining, exchange hacks, the blockchain split, price surges, and mining changes.
- Color
- Near-black and deep navy backgrounds with white and gray text, orange accents, cyan charts, and occasional red highlights.
- Type
- Bold, clean sans-serif headlines paired with small uppercase labels, dates, and compact numeric readouts.
- Framing
- Minimal infographic panels with generous negative space. Headlines and explanatory text sit beside or above charts, with key figures emphasized in large colored type.
- Structure
- A sequence of dated historical milestones, using price and hash-rate graphs, timeline markers, and simple Bitcoin-themed icons to present events.