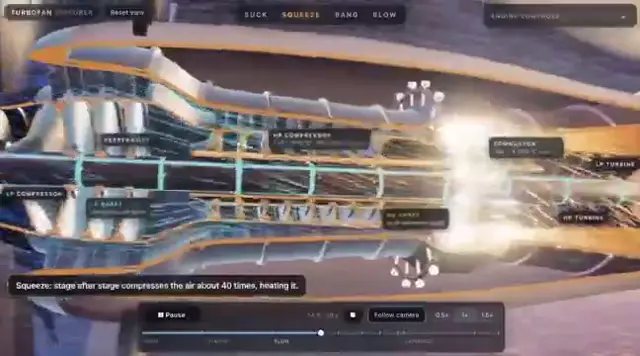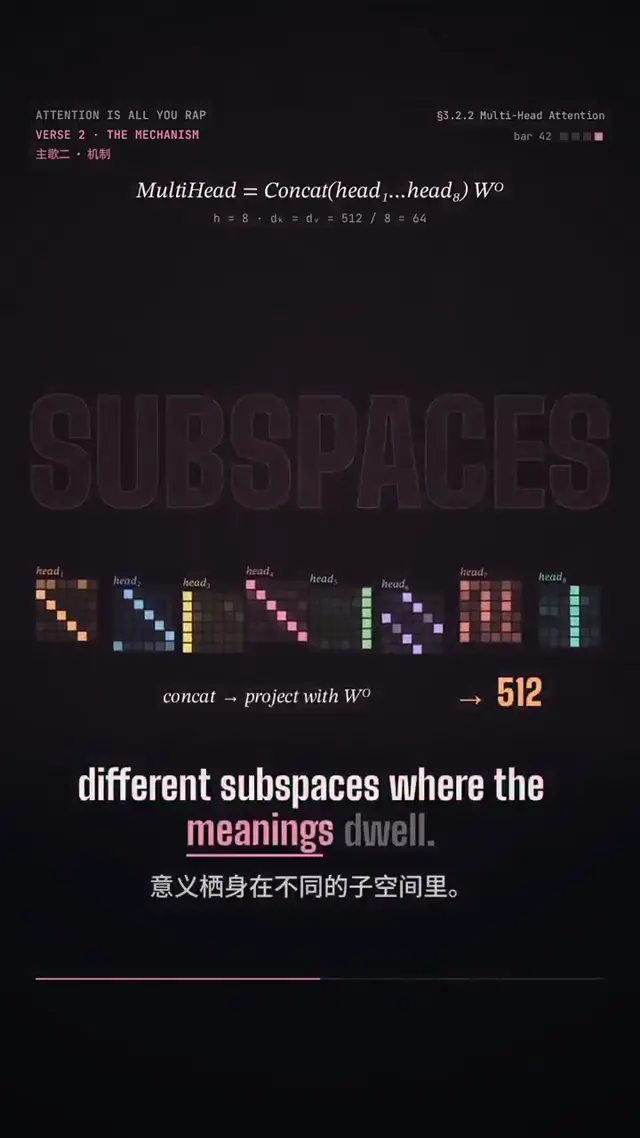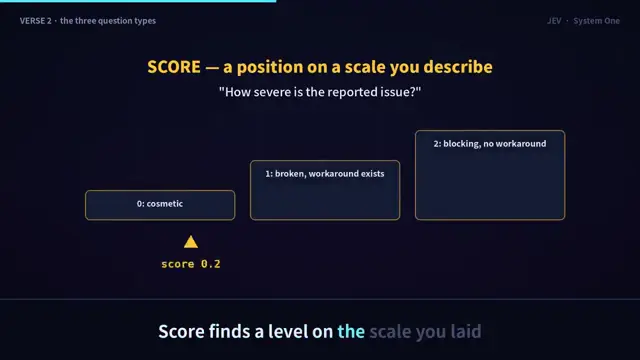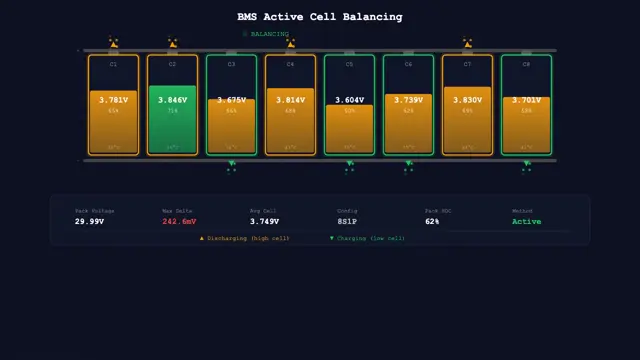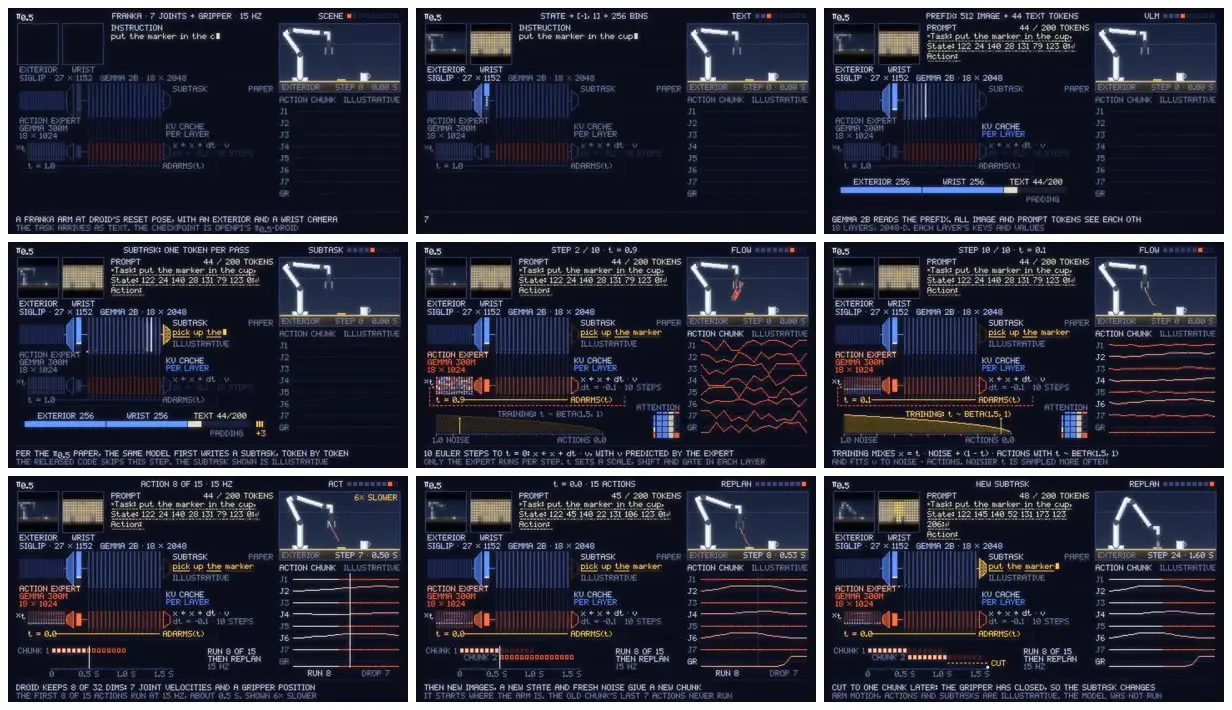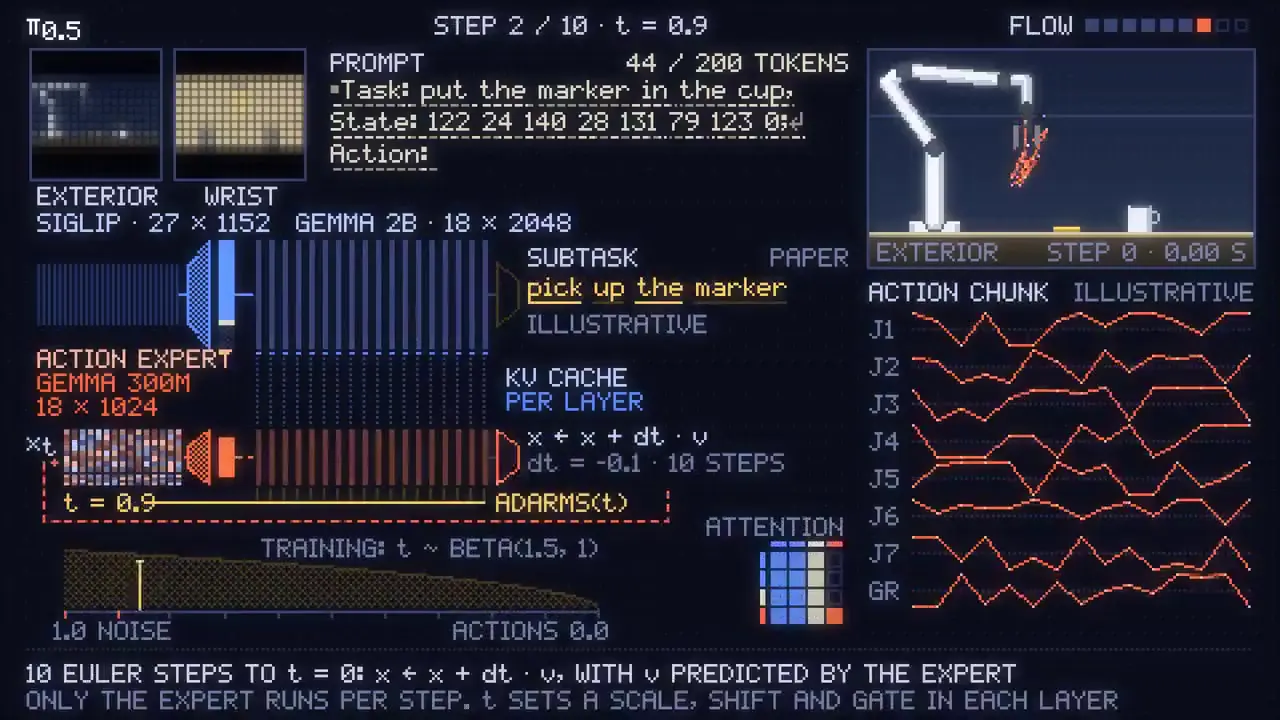
Adapt this dashboard layout to another machine-learning or industrial process, keeping inputs, intermediate representations and physical results in fixed regions. Assign separate colors to conditioning data and predicted outputs, then repeat those colors in diagrams and plots. Include a small real-world result panel and short explanatory captions so abstract computations remain grounded.
No creator prompt published. Reference wrote this brief. Copy for agent includes the brief, visual reference links, and setup guidance.
Robot inference pipeline dashboard
A dark technical dashboard explains π0.5 robot inference through image and text inputs, model blocks, action traces and a robot scene, progressing from task instructions to action chunks and replanning.
How it was made
Opus 5.5
Source and credit
X · Sep 23, 2026 · 203 likes · 15k views · 7 comments
Made with AI, according to the source
Look notesby Reference
A technical infographic visualizes a robot arm responding to the instruction to put a marker in a cup, alongside diagrams of how the model processes inputs and produces actions.
- Color
- Very dark navy and black backgrounds with cyan, blue, orange, yellow, and muted red accents.
- Type
- Dense, small uppercase sans-serif labels and monospaced-looking technical readouts; interface text is integrated throughout the diagrams.
- Framing
- Each frame is arranged as a compact dashboard, pairing a small robot-arm illustration with prompt text, system indicators, token or action bars, and graph-like readouts.
- Structure
- The sequence progresses from task and robot context to image-and-text inputs, then shows token and action representations, action chunks, and a revised subtask.