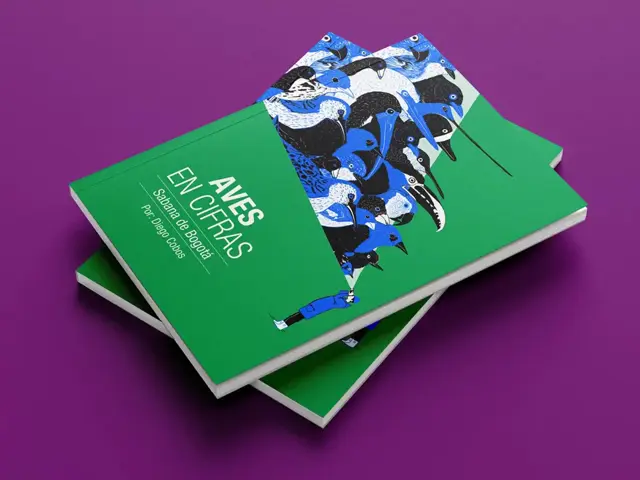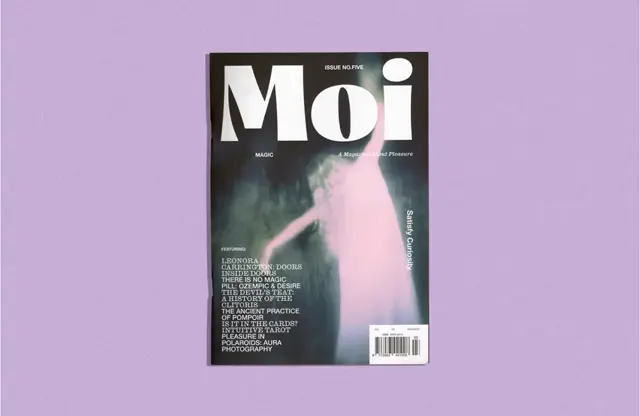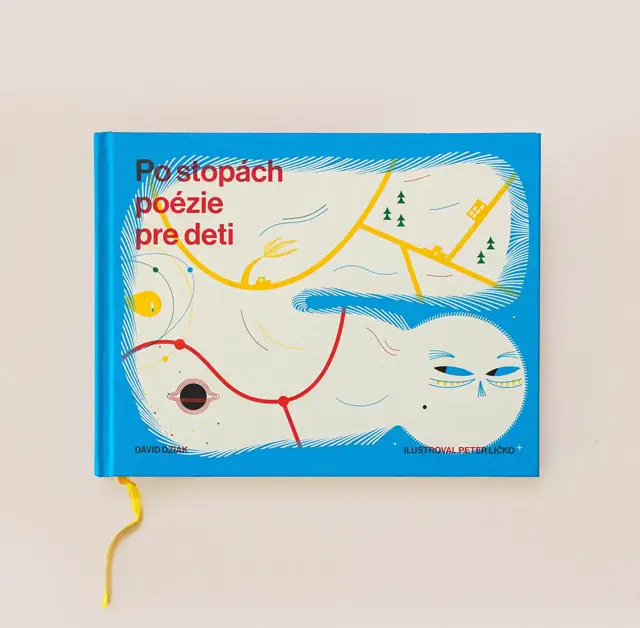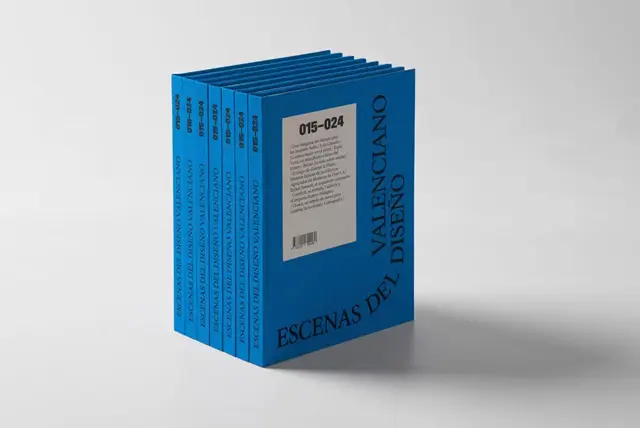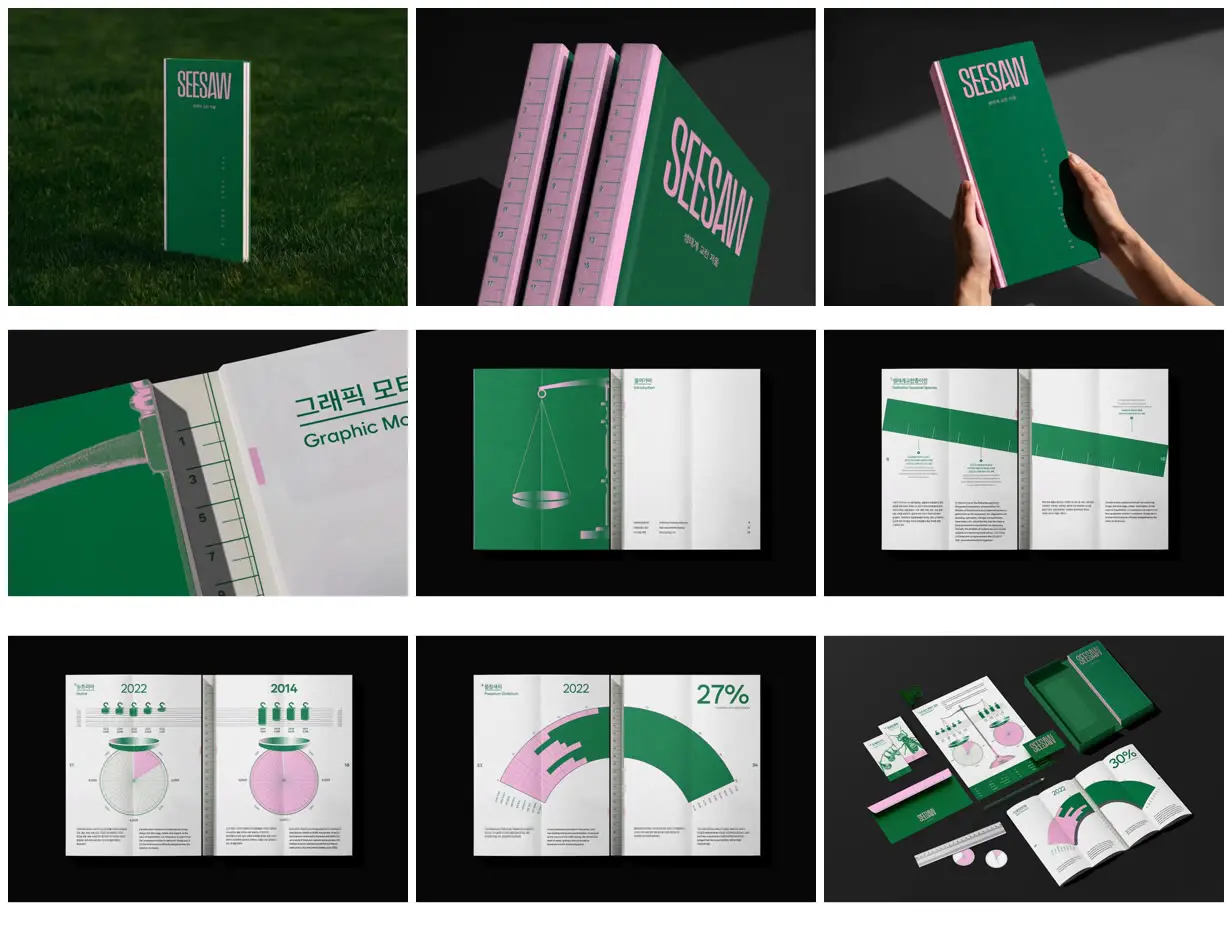
Turn a subject-specific physical metaphor into the organizing graphic system, as the ruler-marked gutter, weight silhouettes, and circular scale faces do here. Pair oversized diagrams with compact captions and use two contrasting colors consistently across covers, charts, and navigation markers. For a new subject, replace the species data and balance imagery with an appropriate comparison metaphor, and provide explicit legends and units for each adapted chart.
No creator prompt published. Reference wrote this brief. Copy for agent includes the brief, visual reference links, and setup guidance.
Species data on a balance scale
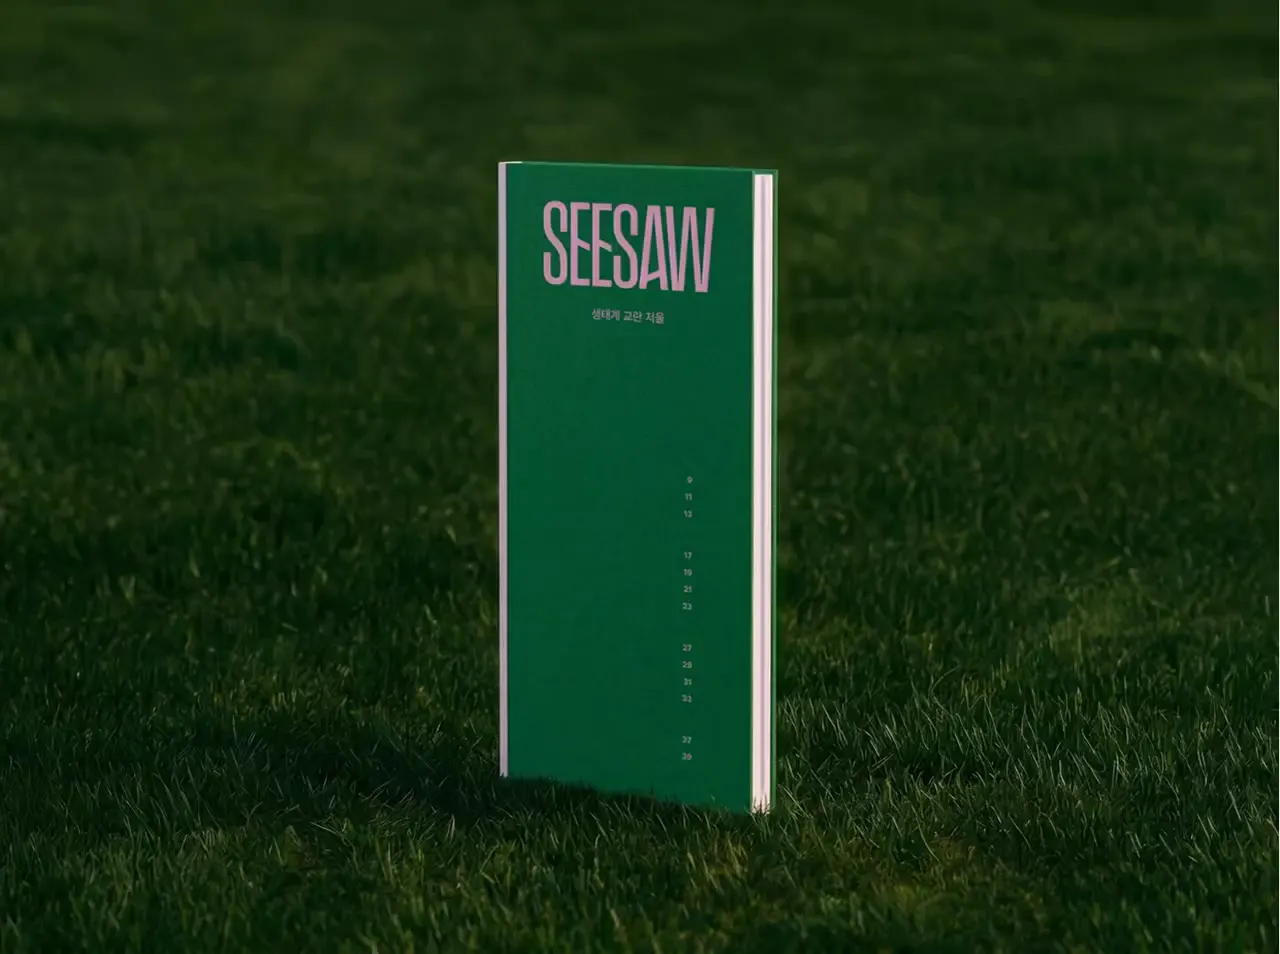
A tall green-and-pink concept book with ruler-marked binding, bilingual species spreads, weight-shaped charts, circular gauges, and segmented arc diagrams, shown alongside coordinated cards, a poster, and packaging.
Source and credit
Website · Aug 14, 2025 · 12k views · 67 comments
Authorship not stated by the source
Look notesby Reference
A polished infographic book uses balance-scale and seesaw imagery to present comparative species data.
- Color
- Deep green, pale pink, white, and charcoal, with restrained gray chart details.
- Type
- Tall condensed sans-serif cover lettering paired with clean sans-serif headings, labels, and numerals; some headings are in Korean.
- Framing
- Minimal editorial layouts with generous white space, clear data panels, and recurring balance-scale diagrams and chart forms.
- Structure
- A green cover introduces the book, followed by explanatory and comparative data spreads with charts and figures; a final presentation shows the book alongside related printed pieces.