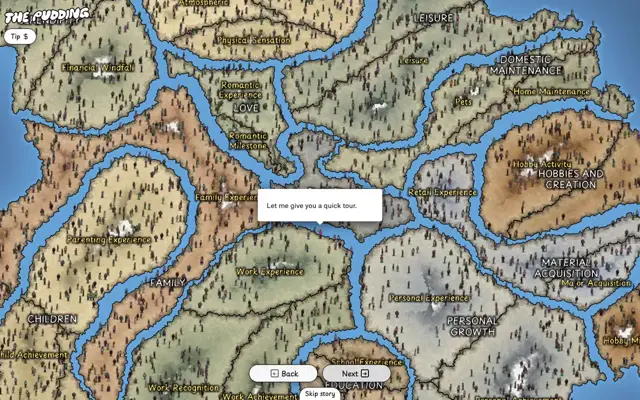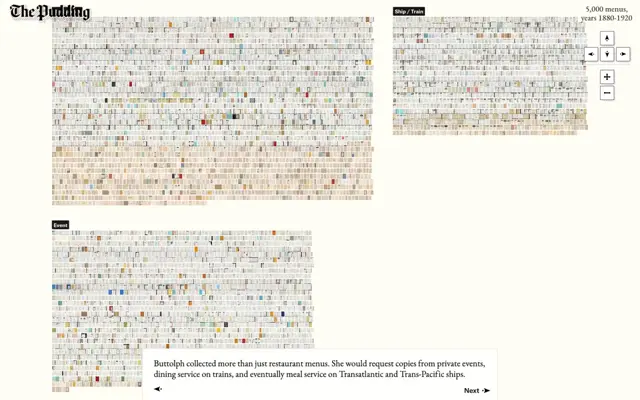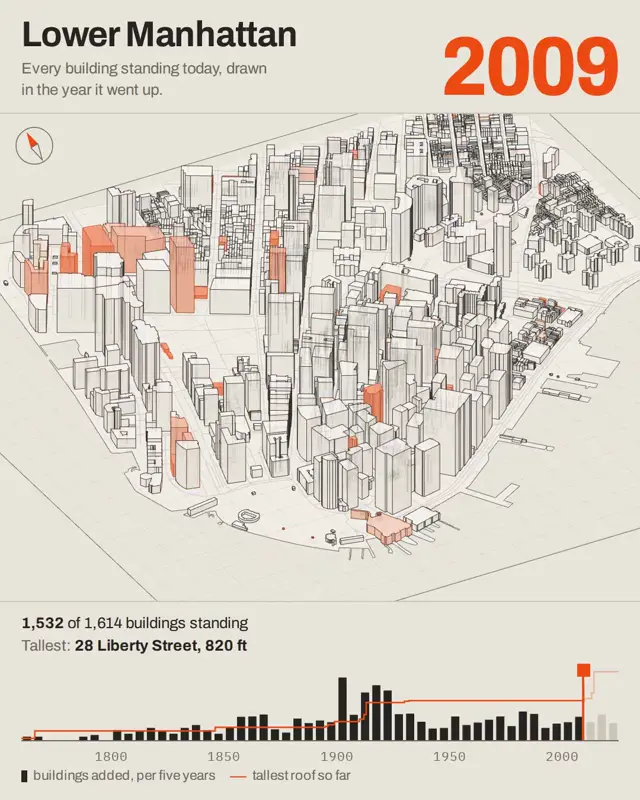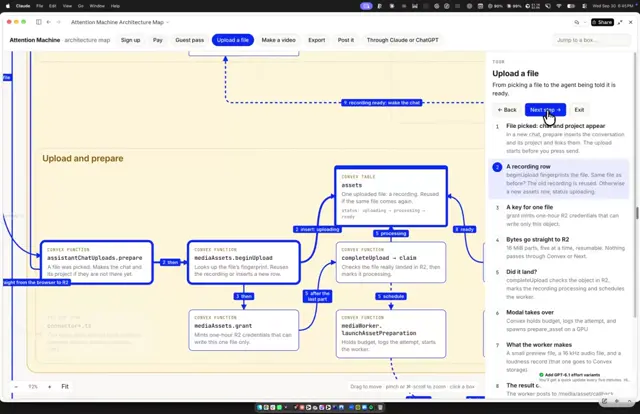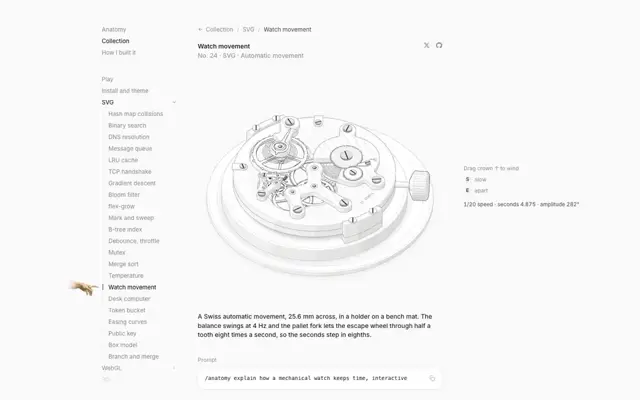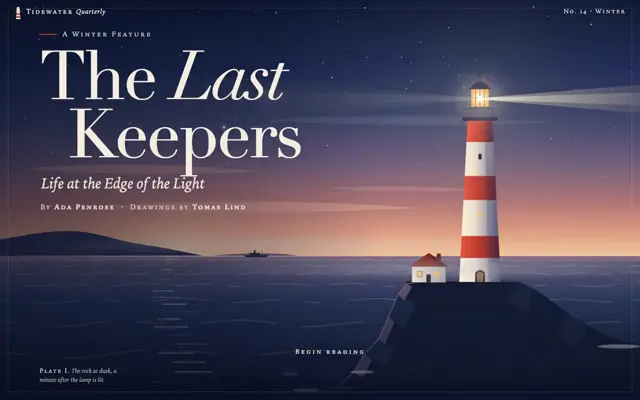
Use textured human miniatures as both individual story characters and repeated units in population charts, preserving the connection between personal experience and aggregate data. Repeat category colors across figure groups, compact legends, and inline highlighted words, then alternate expansive data fields with narrow prose and thin-line charts. For a new subject, replace the relationship narrative, character props, grouping labels, and measurements while retaining this individual-to-population visual structure.
No creator prompt published. This brief was written by Reference.
A love story
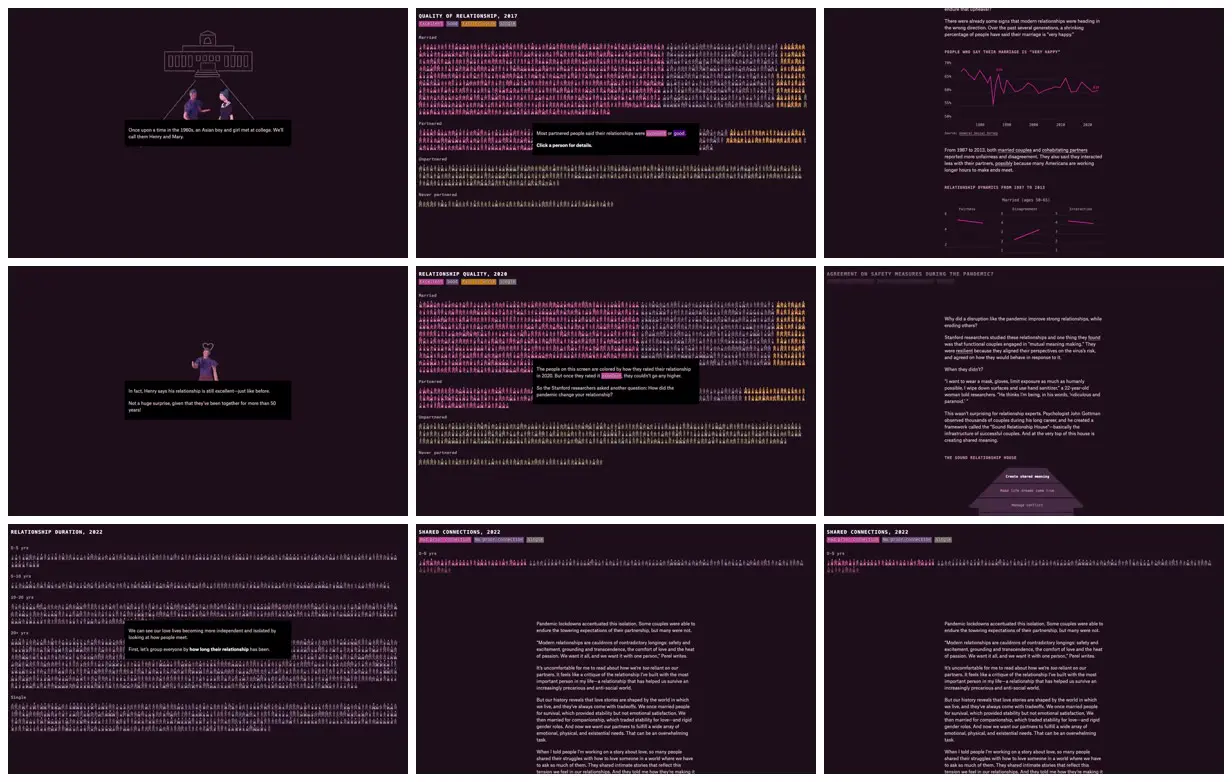
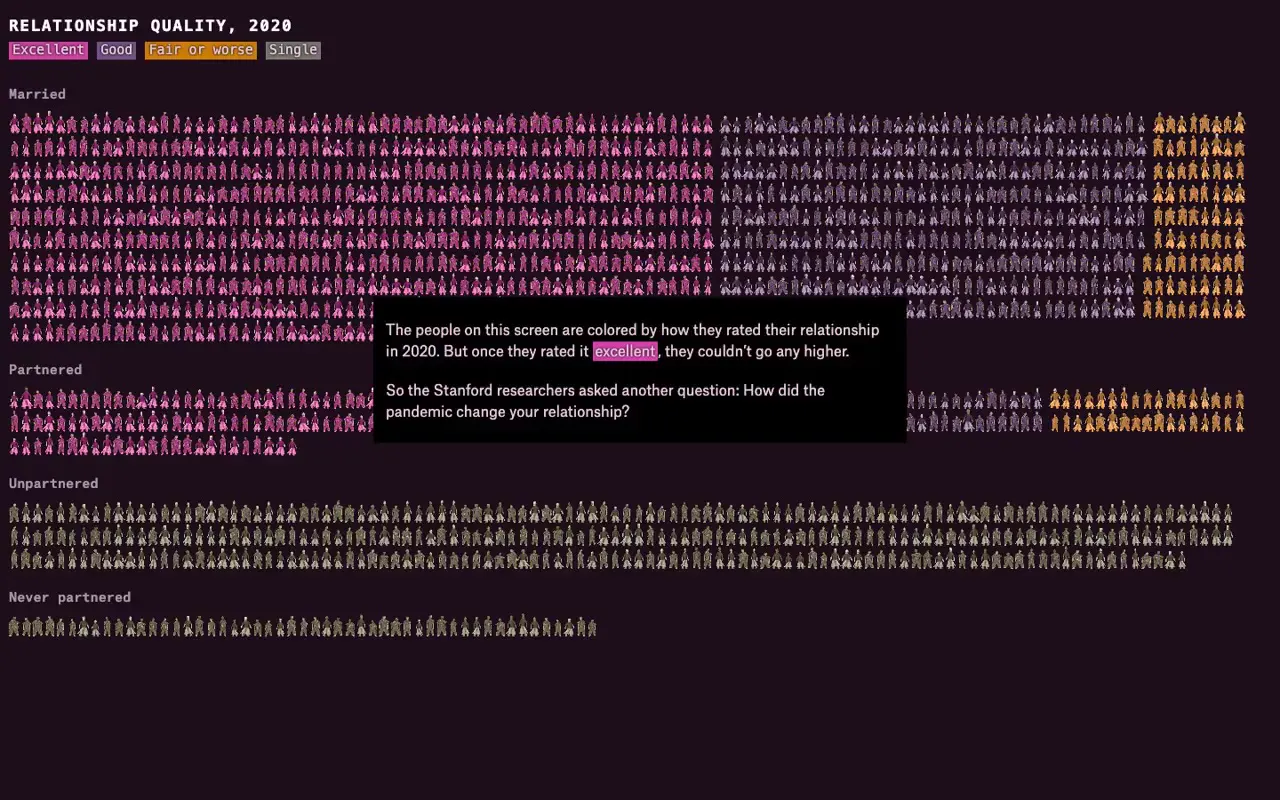
An illustrated relationship-data story pairs miniature human figures and sketched settings with population grids, trend charts, and a house-shaped diagram, comparing relationship quality, duration, and shared connections.
Source and credit
Look notesby Reference
Dark, minimal data-journalism style with small illustrative accents.
- Color
- Near-black aubergine backgrounds with magenta, violet, muted gray, and occasional gold.
- Type
- Small monospace section headings paired with compact sans-serif body text.
- Framing
- Wide fields of miniature people form color-coded population charts; intimate character scenes and narrow reading columns provide contrast, with black narrative panels over selected scenes.
- Structure
- An editorial story on relationships, arranged in sections with data visualizations, explanatory text, and simple character illustrations.