Animated UMAP explainer for undergraduates
A 5-minute narrated explainer on how UMAP works: nearest-neighbor graphs, fuzzy weights, layout by attraction and repulsion, and how to read the plots. Claude Opus 5.5 wrote the narration and designed the visuals, prompted from Claude Code on a phone.
“All of this—the concepts for the visuals, the narration, etc.—is from Claude. Prompted in Claude Code on my phone.”
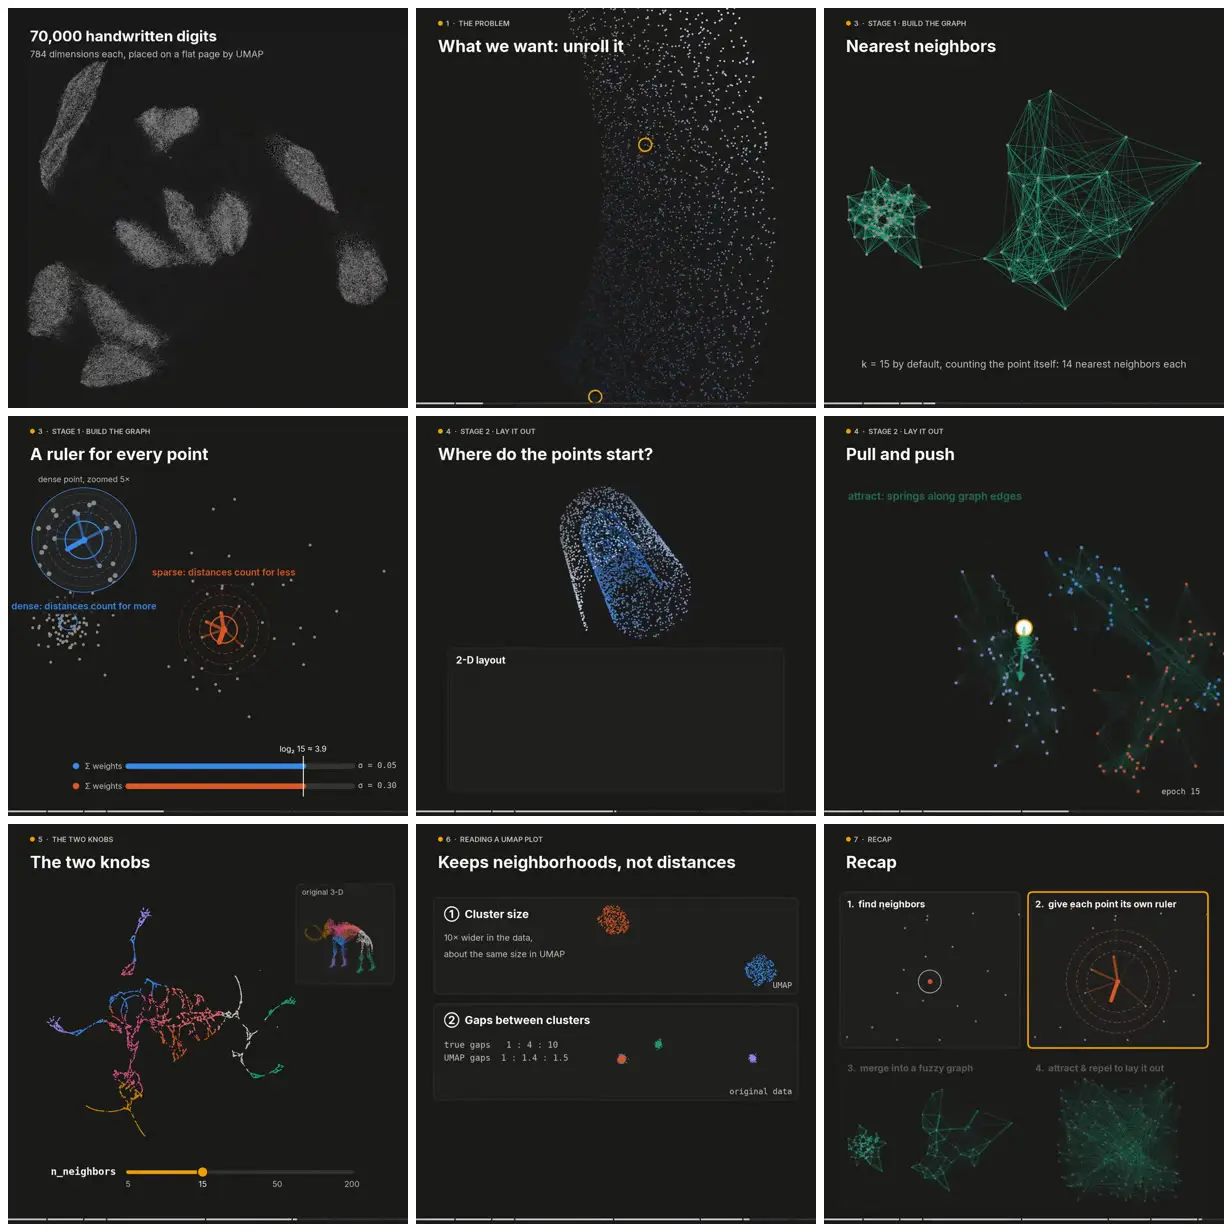
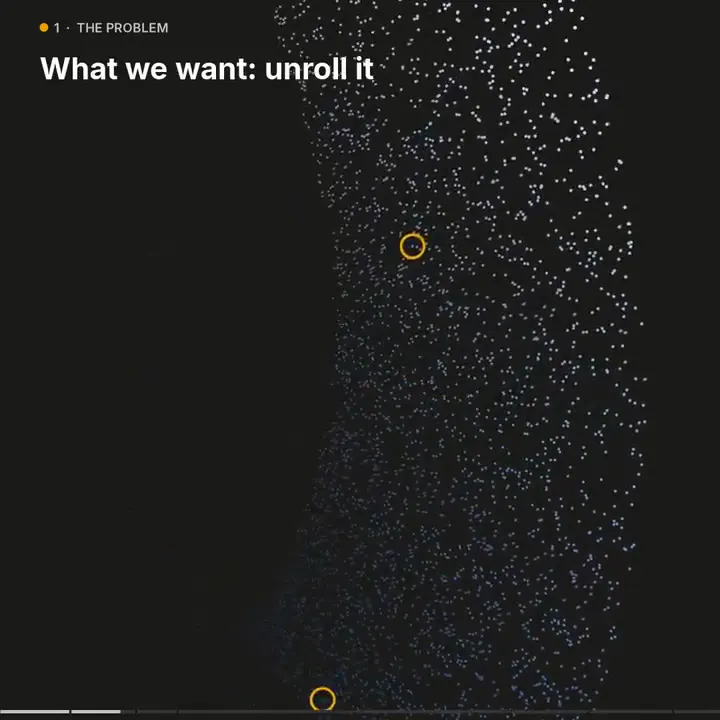
Teach an algorithm in numbered chapters on a near-black field, each opened by a small orange chapter label and one plain heading. Build every idea from custom point clouds and graphs: teal edges for neighbor links, distinct colors for clusters, yellow rings on the points being discussed. Use side-by-side panels for comparisons and labeled sliders for parameters, and close on a four-panel recap. For a new subject, keep the chapter structure and replace the diagrams with your own data.
No creator prompt published. This brief was written by Reference.
How it was made
In a reply the creator says it took a few rounds of planning and outlining at medium effort, then one prompt at Extra effort to make the video. The prompts are in a shared Claude Code session that needs a claude.ai sign-in, so Reference has not copied them.
Claude Code · Claude Opus 5.5
Source and credit
X · Sep 25, 2026 · 1.2k likes · 57k views · 62 comments
Made with AI, according to the source
Look notesby Reference
A dark, diagram-led lecture on UMAP in numbered chapters, built from point clouds, neighbor graphs and small labeled panels.
- Color
- Near-black background, white headings, grey points, teal-green graph edges, blue and orange for dense and sparse points, multicolored clusters, and yellow rings and sliders.
- Type
- Bold sans headings at the top left ("Nearest neighbors", "Pull and push", "The two knobs"), small orange-dot chapter labels such as "3 · STAGE 1 · BUILD THE GRAPH", and monospace for parameters and values.
- Framing
- Square frames with the heading at the top left and one large diagram below; comparisons sit in rounded panels, and a thin progress bar runs along the bottom edge.
- Structure
- 70,000 handwritten digits as the hook, the problem of unrolling a curled sheet, building the neighbor graph and a per-point ruler, where layout starts and pull-and-push, the two parameters on a mammoth point cloud, how to read a UMAP plot, and a four-panel recap.