manim script to show 6 big steps of solving a statistics chi-square goodness of fit test problem related to zoo visitor daily uniform distribution, also guide me how to run everything because i am a newbie to Manim
Make it yours. Change "a statistics chi-square goodness of fit test problem related to zoo visitor daily uniform distribution" to your own problem, and "6 big steps" to the number of steps. Drop the last clause if you already know how to run Manim.
Chi-square goodness-of-fit test in Manim
A 38-second Manim animation that works a chi-square goodness-of-fit test on daily zoo visitors, from the hypotheses to the decision. Gemini wrote the script from a one-line request, and the creator, new to Manim, ran it on Windows and pasted any errors back.
You'll need
- Python and Manim installed locally
- Any Gemini chat to write the script
How it was made
The creator's steps: install Python and Manim on Windows, get the script from Gemini with this prompt, save it as chi_square_test.py, and run manim -pql chi_square_test.py ChiSquareTestAnimation (a quick low-quality render). If it errors, paste the terminal error back into Gemini for a new full script. Whether that was needed here isn't stated, and neither is the Gemini version.
Posted Dec 10, 2025 · YouTube · 8 views
Prompt from: YouTube description, step 3
Look notesby Reference
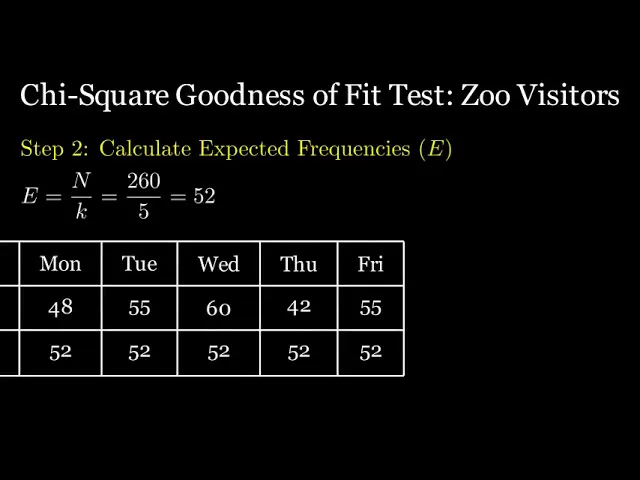
A plain Manim walkthrough on black that works a chi-square goodness-of-fit test on zoo visitors: hypotheses, expected frequencies with an observed-against-expected table for Monday to Friday, the test statistic and degrees of freedom, and the critical-value comparison and conclusion.
- Color
- A black background with white text and table lines, yellow-green step headings, and a green underline arrow in the comparison.
- Type
- Manim's LaTeX serif throughout: a white title "Chi-Square Goodness of Fit Test: Zoo Visitors", yellow-green step headings ("Step 2: Calculate Expected Frequencies (E)"), and typeset math ("E = N/k = 260/5 = 52", "χ² = 6.46", "df = k − 1 = 5 − 1 = 4").
- Framing
- 16:9 with everything left-aligned under the title at the top: a step heading, then lines of math stacked below it, and the table at the left edge. Most of the frame stays empty black.
- Structure
- The title on black, Step 1 with H₀ "Visitors are uniformly distributed", Hₐ, and α = 0.05, Step 2 with E = 260/5 = 52 and a table of observed counts (48, 55, 60, 42, 55) against 52 each, Step 3 with the χ² formula, χ² = 6.46, and df = 4, then "Step 5 & 6: Find Critical Value and Make Decision" (there is no Step 4 heading) with χ²crit = 9.488, "6.46 < 9.488 ⇒ Fail to Reject H₀", and "Conclusion: Visitor distribution is Uniform."