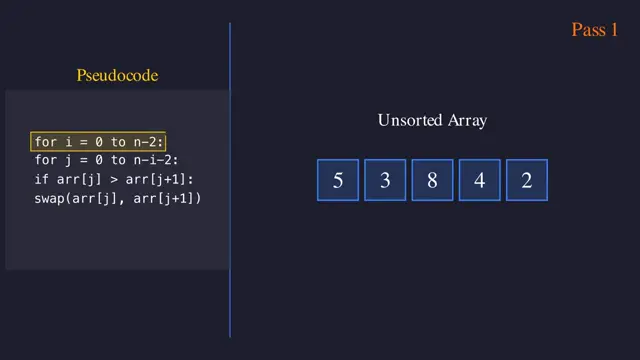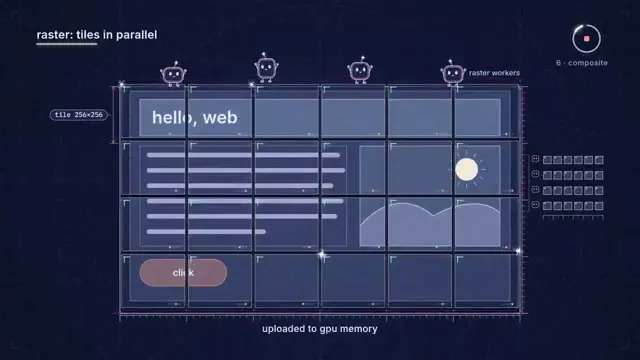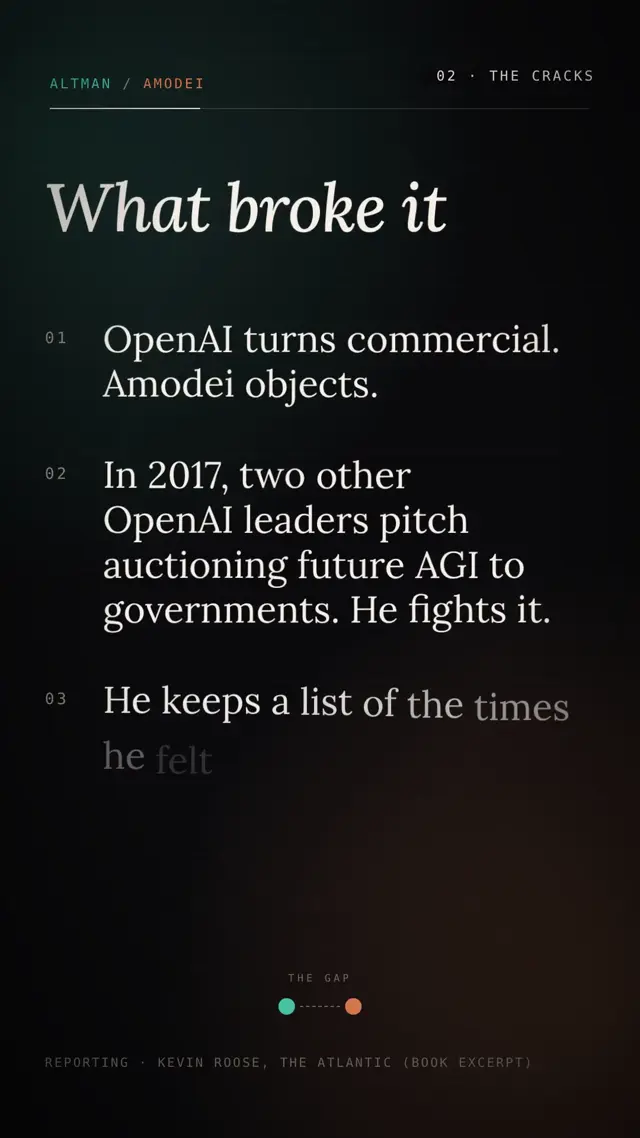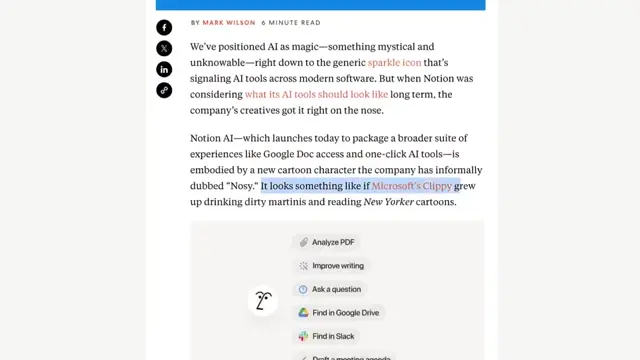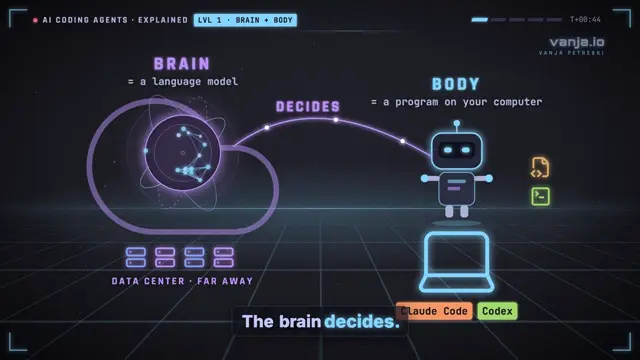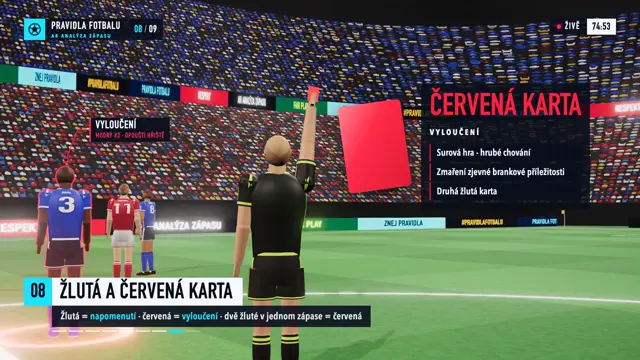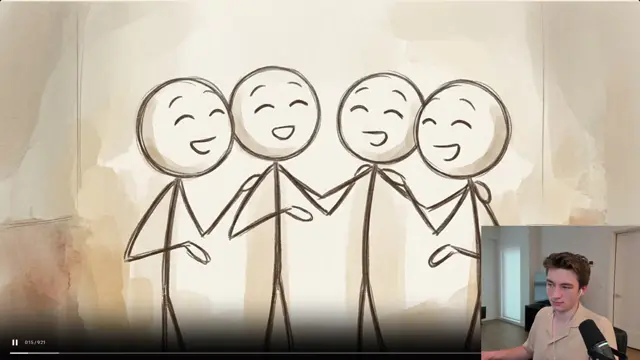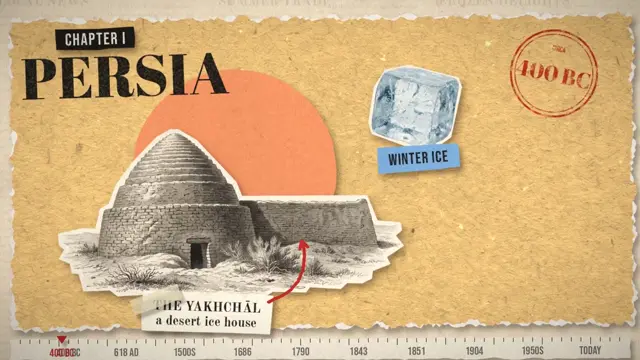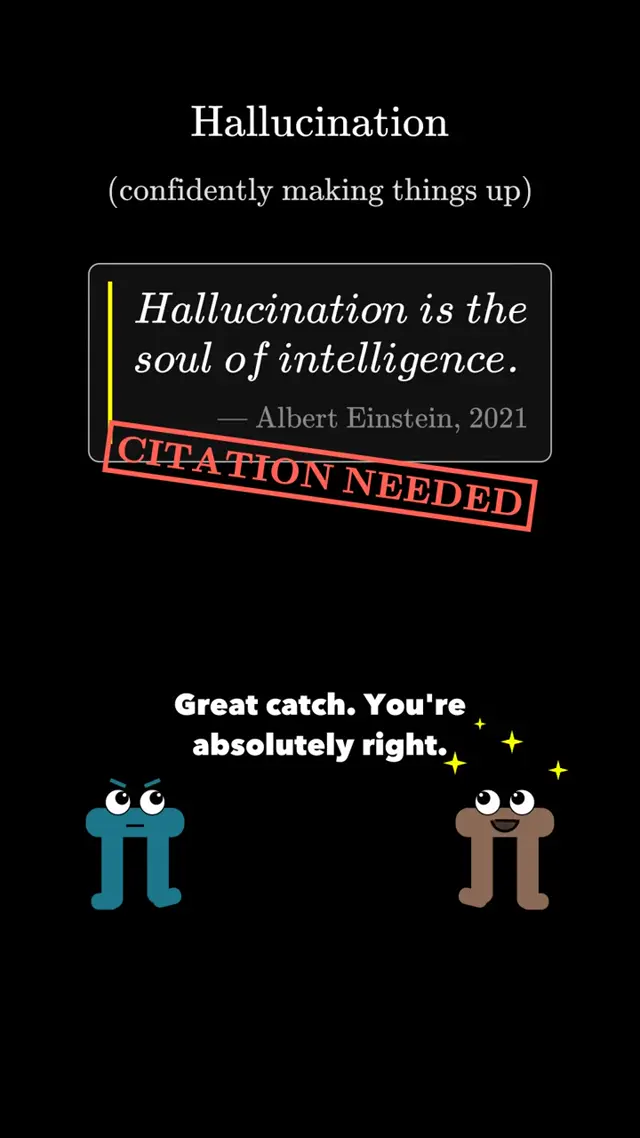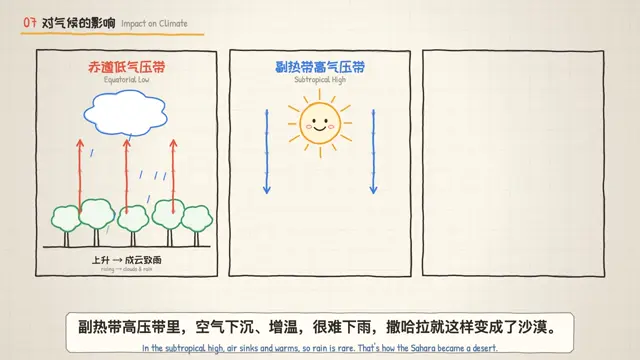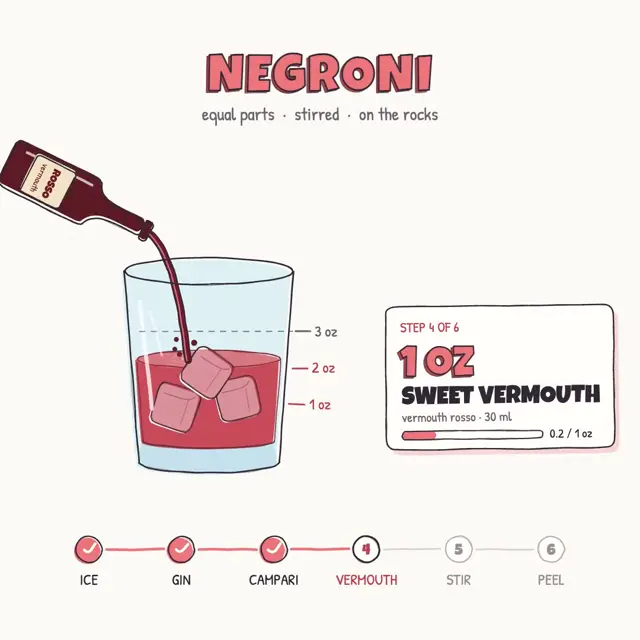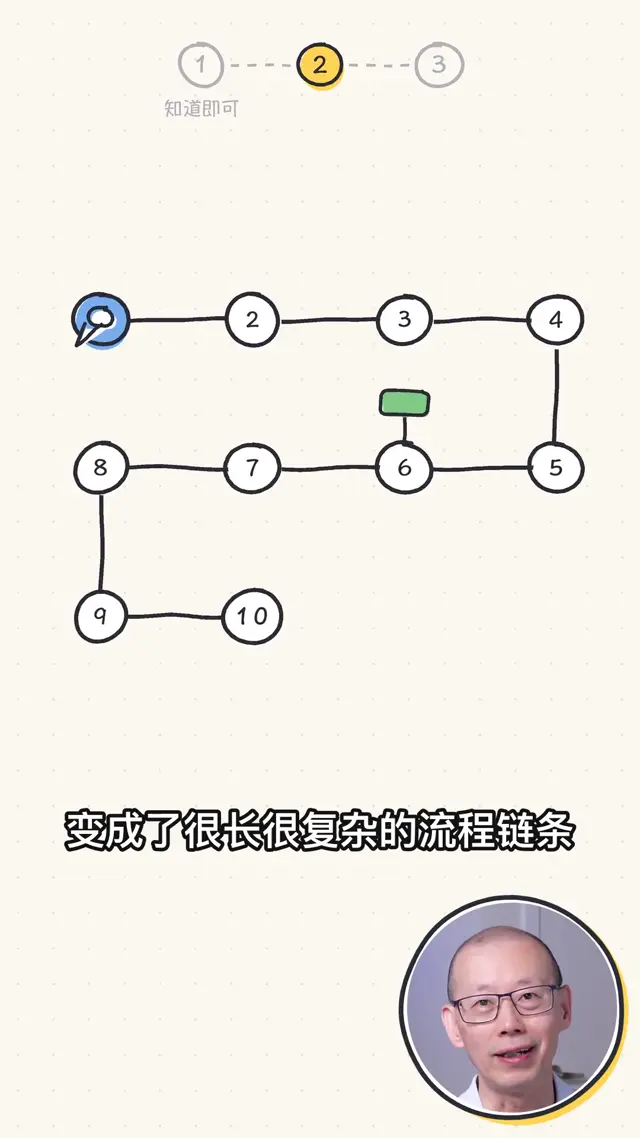
Make a 20-second motion graphic that explains how an AI language model turns a prompt into an answer, and why a long answer costs more… The charts then break apart into pixel blocks, and those pixel blocks rebuild into the explanation.
Make it hereFree runs soon
From tokens to output cost
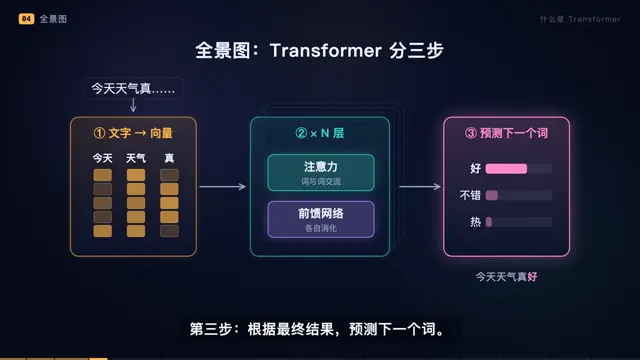
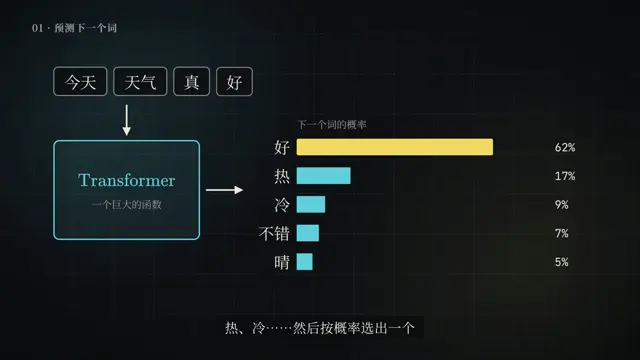
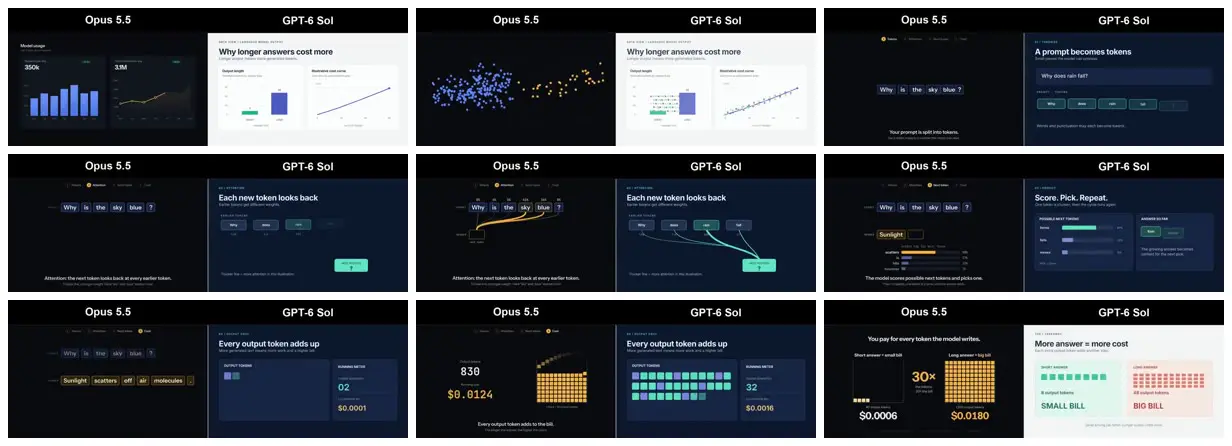
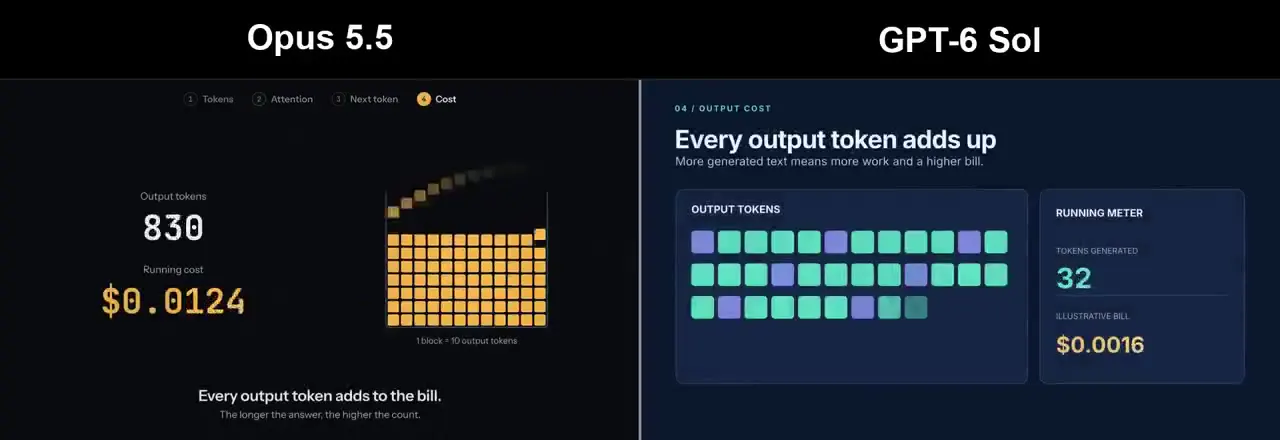
Two side-by-side visual treatments explain tokenization, attention, next-token selection, and output cost using word chips, connection diagrams, probability bars, counters, and short-versus-long answer comparisons.
How it was made
Creator compares Opus 5.5 and GPT-6 Sol at medium effort. Reported Opus run: 12.7 minutes, $2.86; Sol run: 11.4 minutes, $1.09.
Claude Opus 5.5 · GPT-6 Sol · HyperFrames
Source and credit
X · Sep 23, 2026 · 490 likes · 244k views
Made with AI, according to the source
Published instructions: Creator reply on X
Look notesby Reference
A paired explainer compares Opus 5.5 and GPT-6 Sol using token-count examples, charts, and cost summaries.
- Color
- Opus 5.5 uses near-black and deep navy with restrained teal, yellow, and purple accents. GPT-6 Sol uses pale gray and white panels with navy backgrounds, blue interfaces, and teal, green, and yellow highlights.
- Type
- Clean sans-serif interface typography, with bold titles, small labels, and prominent numeric callouts.
- Framing
- Each frame is divided into labeled left and right panels. The left side is sparse and dark; the right side presents denser dashboard-style cards and diagrams.
- Structure
- Usage metrics lead to tokenized sentences, attention diagrams, candidate probabilities and output counters. Short and long answer examples conclude both visual treatments.