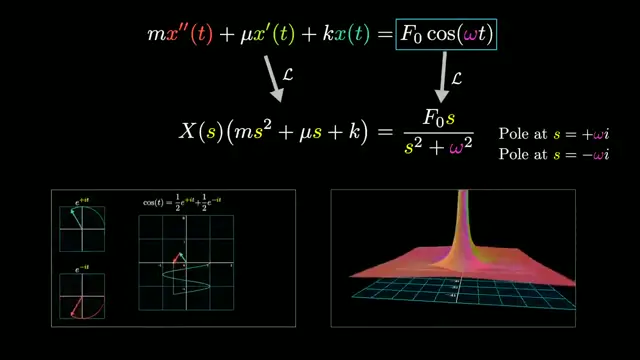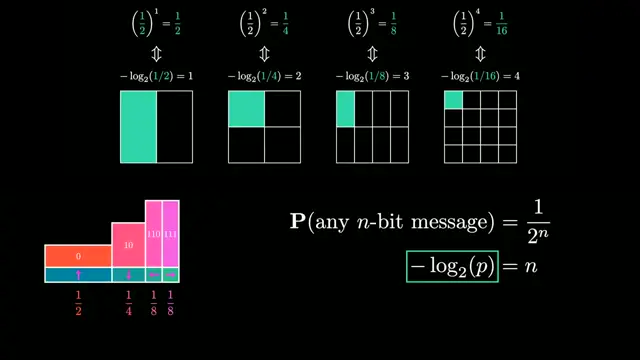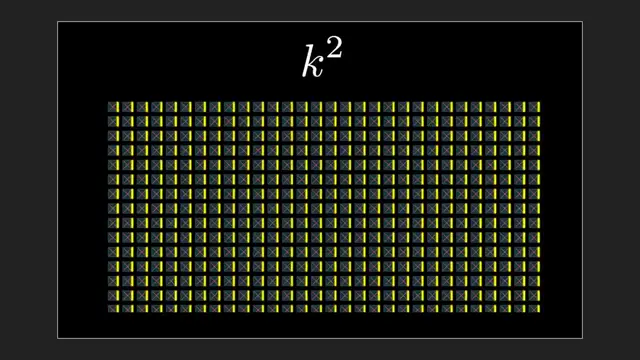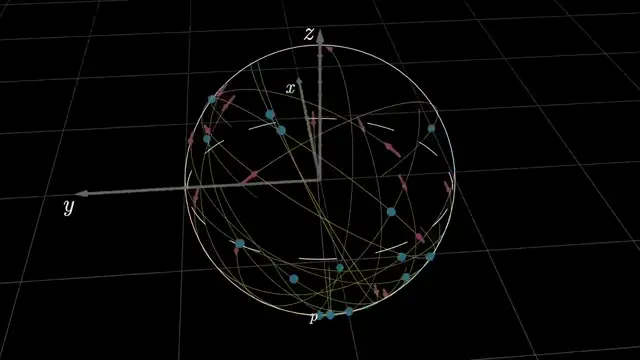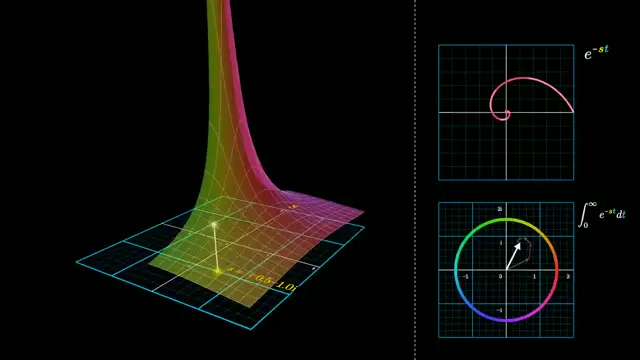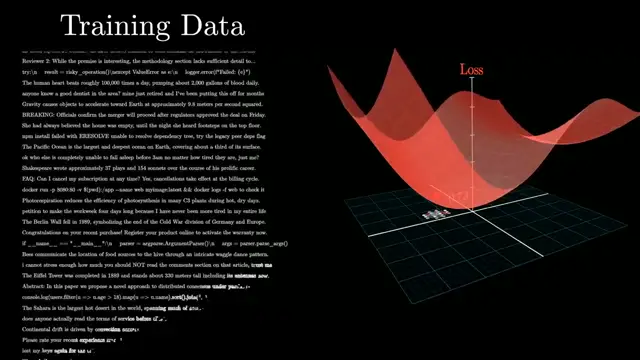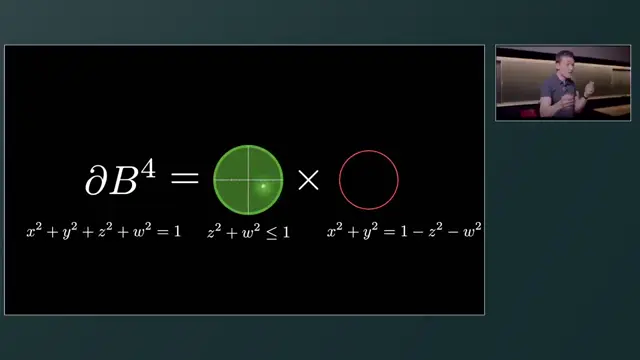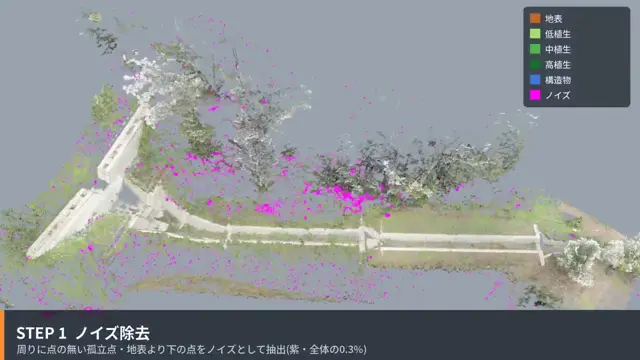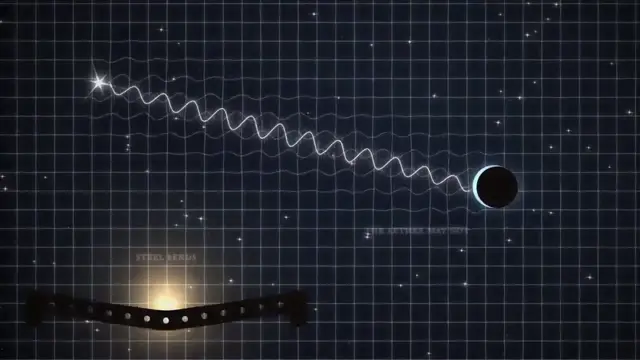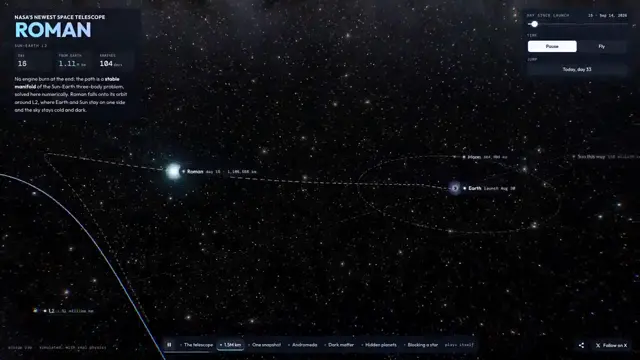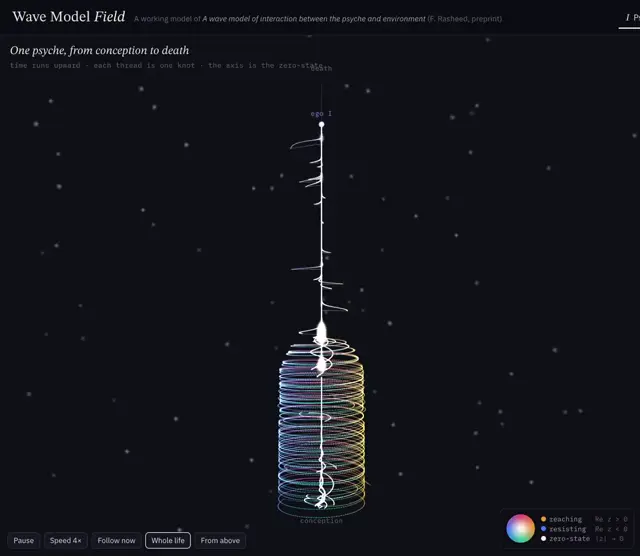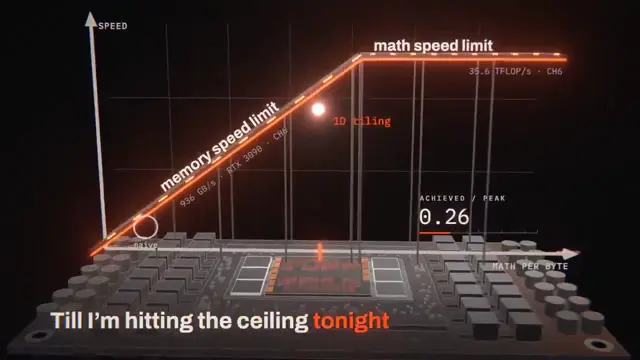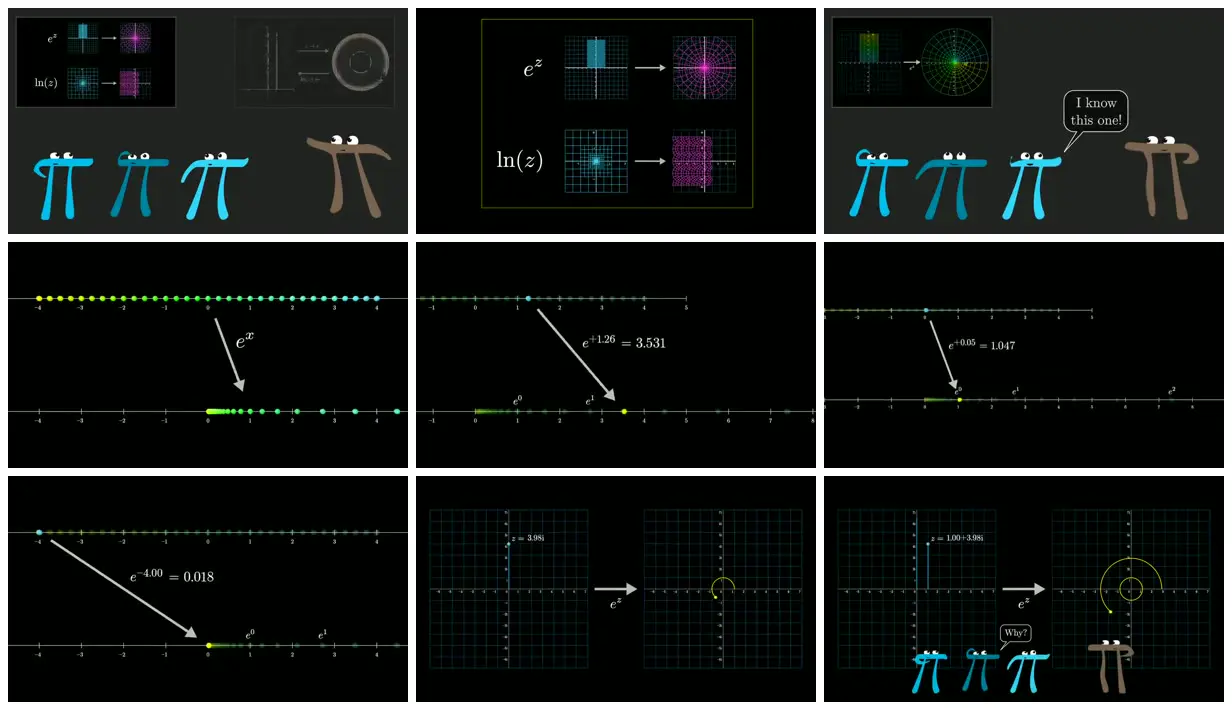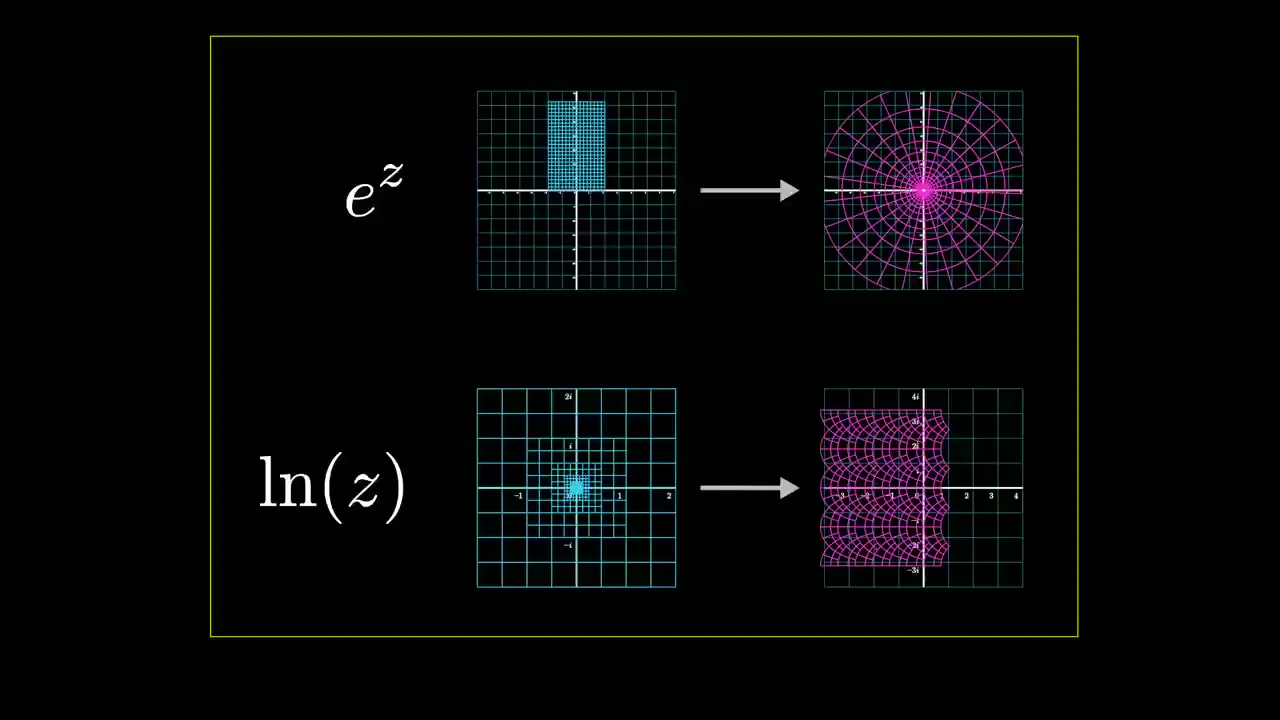
Choose a richly detailed image and use it as the recurring example across several abstract representations. Pair each representation with a simple grid, mapping arrow, and consistent colored landmarks so viewers can identify corresponding regions. Contrast subdued artwork with a dark diagram field, and use small expressive characters to give conceptual sections a recognizable visual identity.
No creator prompt published. Reference wrote this brief. Copy for agent includes the brief, visual reference links, and setup guidance.
Escher prints and complex logarithms
Escher’s Print Gallery becomes a visual route into complex analysis, pairing distorted architectural imagery with warped grids, exponential mappings, equations, and expressive pi-shaped characters.
How it was made
Reference shows a muted excerpt from 21:40 to 23:10. Watch the complete video at the original source.
manim
Source and credit
YouTube · Mar 22, 2026 · 82k likes · 2.3M views · 3.7k comments
Authorship not stated by the source
Look notesby Reference
A dark, clean math explainer pairs exponential and logarithmic notation with grid diagrams, number lines, and small expressive π characters.
- Color
- Black and charcoal backgrounds with cyan, teal, lime, and magenta accents; white labels and gray arrows.
- Type
- Thin, precise mathematical lettering and symbols, with simple cartoon π-shaped characters featuring eyes.
- Framing
- Equations and diagrams are arranged around centered grids or horizontal number lines, with arrows connecting values and representations.
- Structure
- The artwork includes paired e^z and ln(z) examples, plotted values on number lines, coordinate grids, and concise annotations such as “Why?” and “I know this one!”.