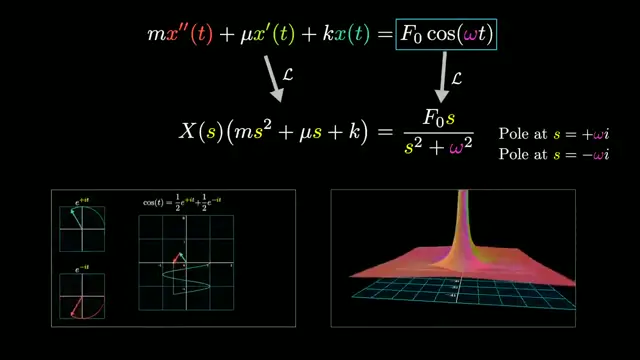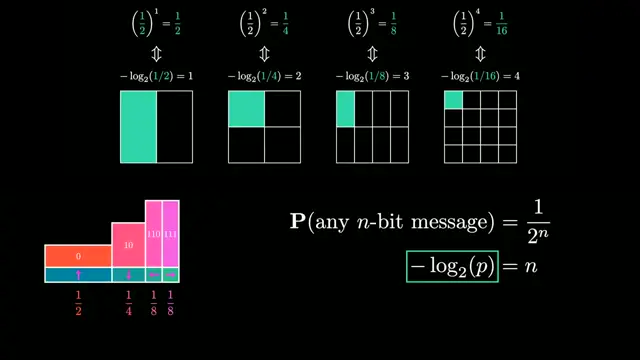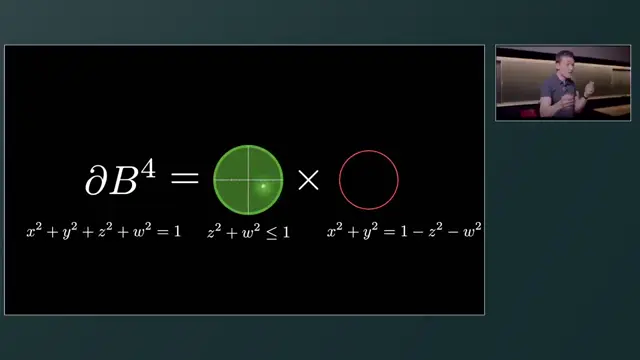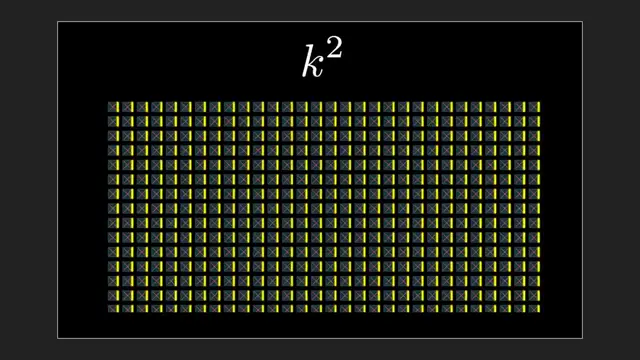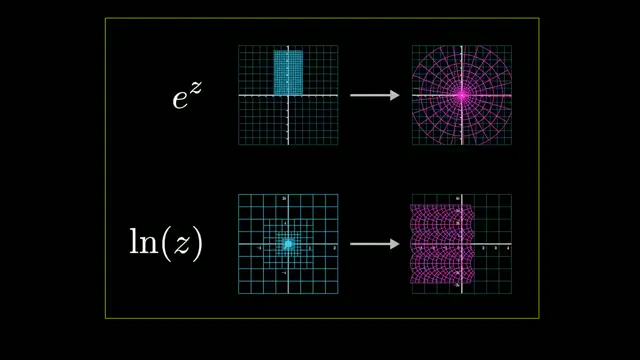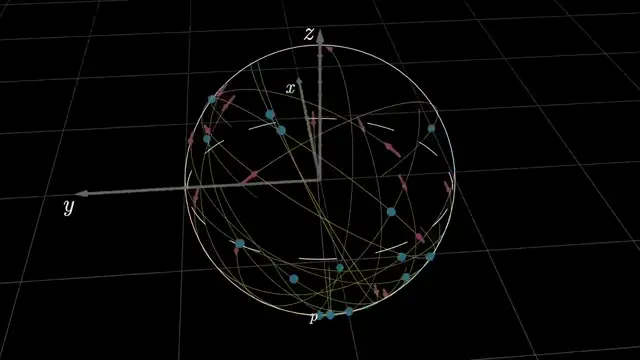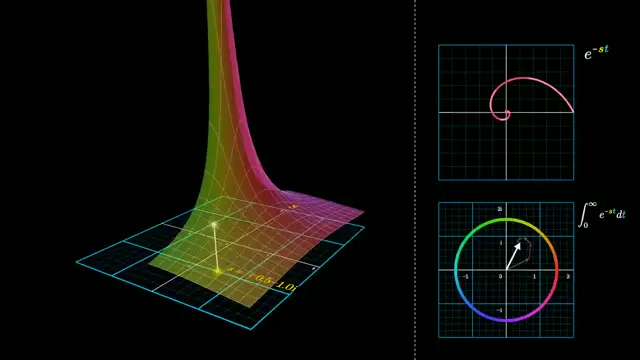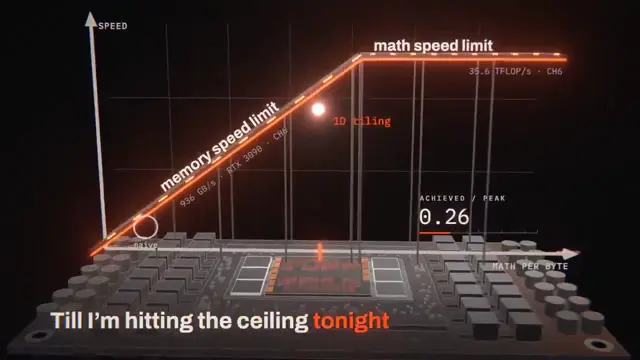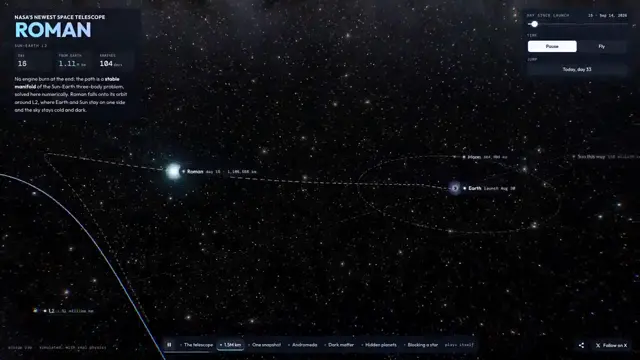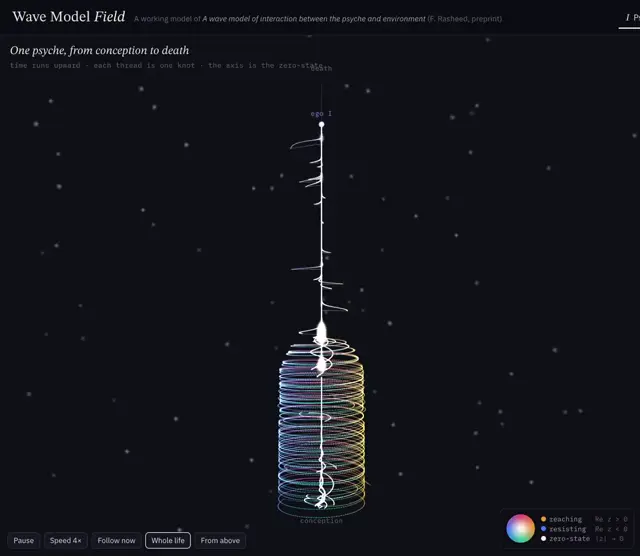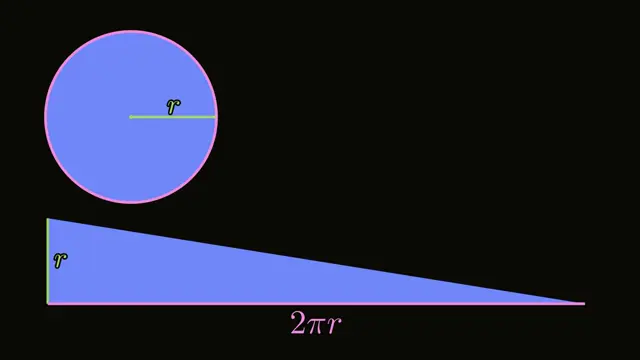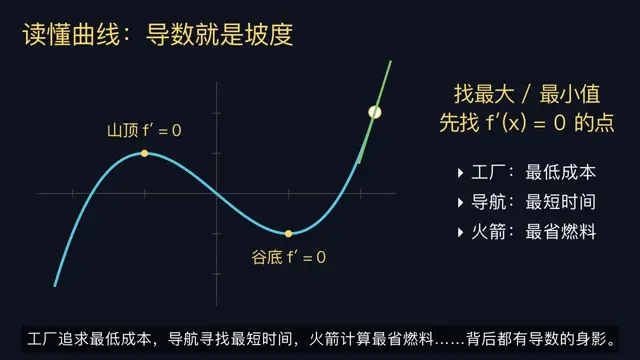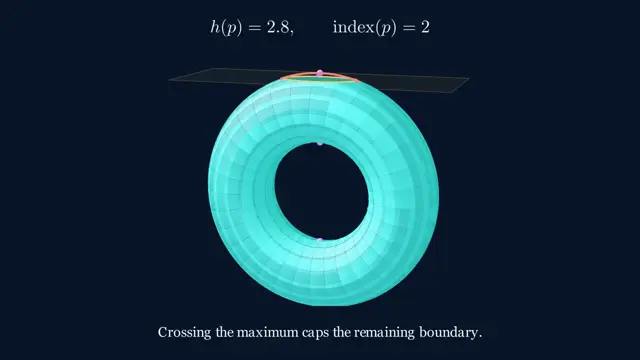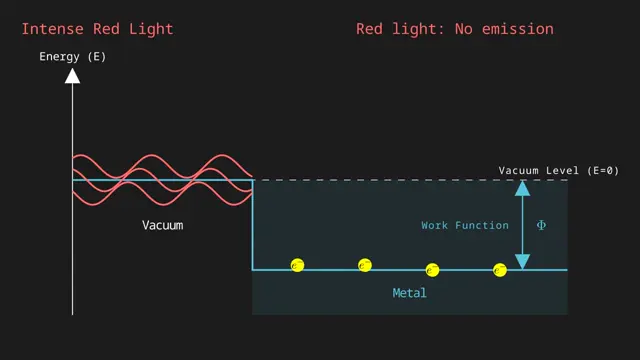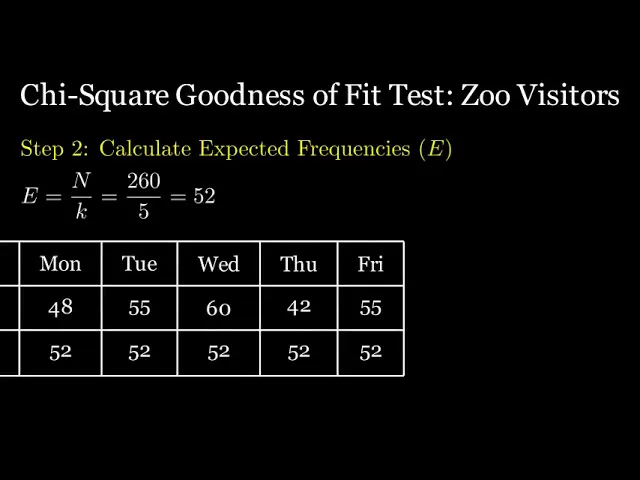
Adapt the color-linked equation-and-diagram approach to another abstract topic, such as risk or resource allocation. Assign each variable a stable accent color and reuse it in labels, bars, and formulas. Pair a concrete worked example with a side-by-side comparison before introducing the general expression.
No creator prompt published. Reference wrote this brief. Copy for agent includes the brief, visual reference links, and setup guidance.
Cross-entropy in bars and language trees
A mathematical explainer connects compression and language prediction to cross-entropy, using color-coded probability bars, branching trees, equations, loss surfaces, and paired distribution diagrams.
How it was made
Reference shows a muted excerpt from 16:10 to 17:40. Watch the complete video at the original source.
Manim
Source and credit
YouTube · Jul 16, 2026 · 22k likes · 869k views · 969 comments
Authorship not stated by the source
Look notesby Reference
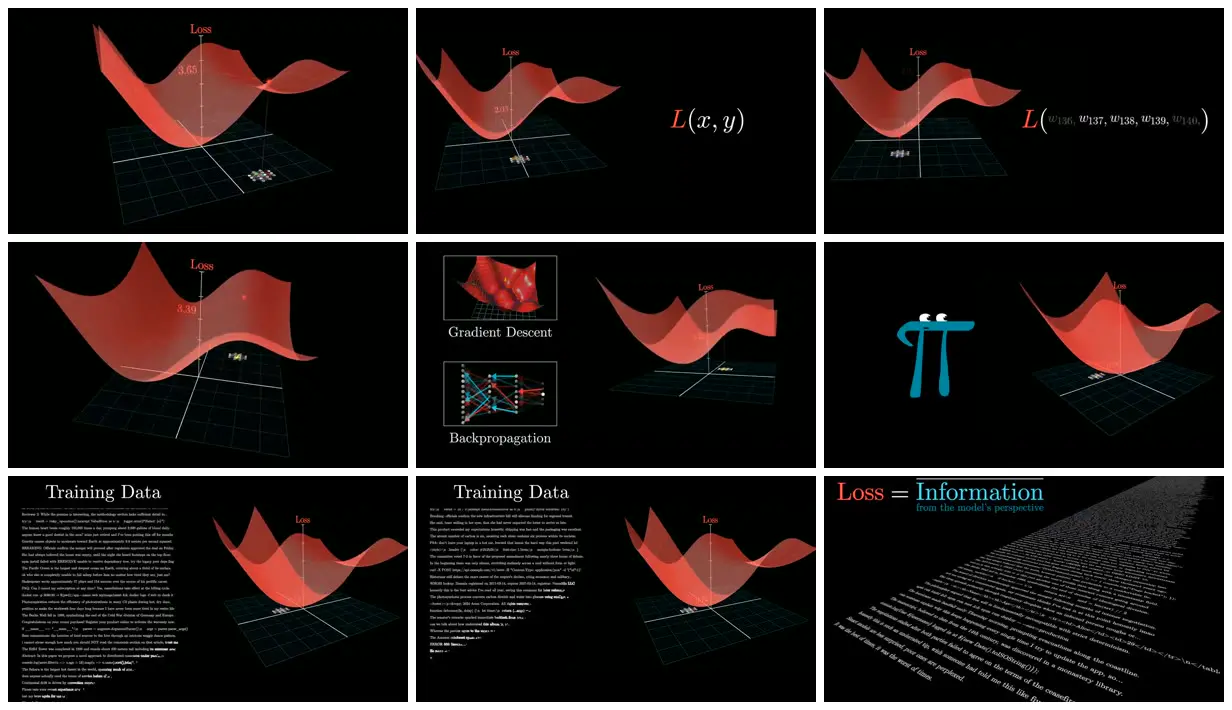
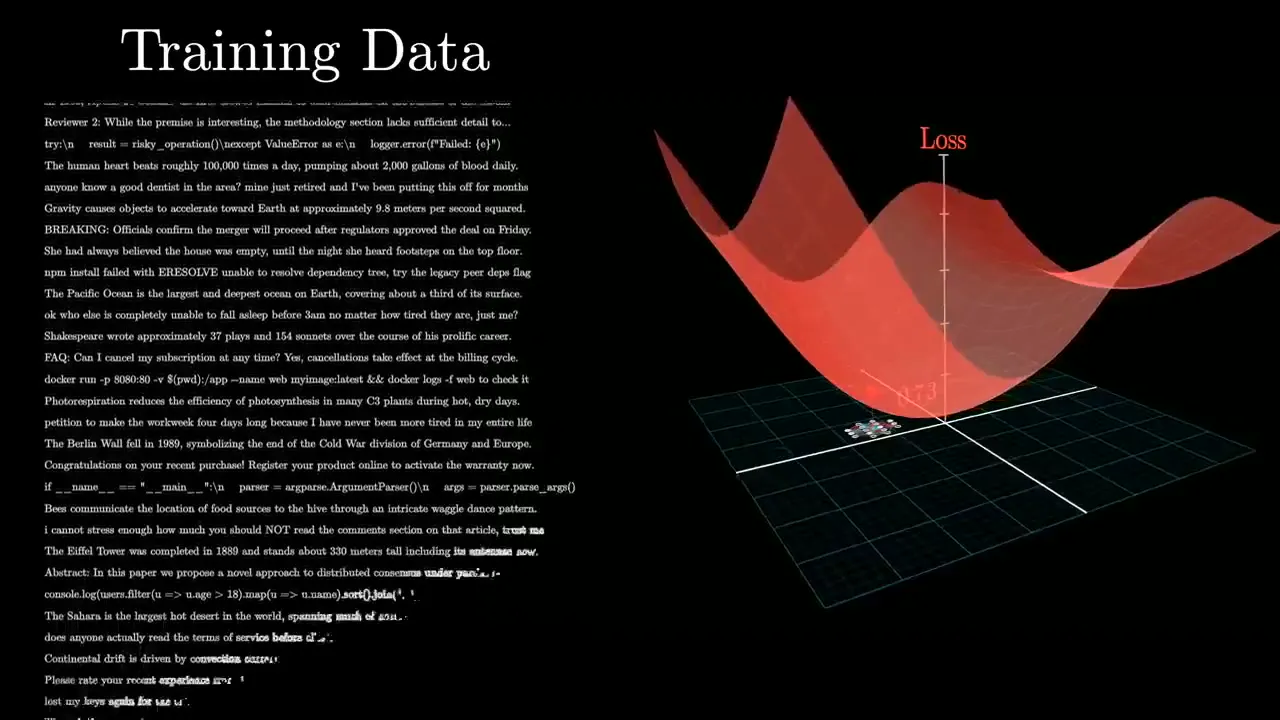
A dark, technical explainer visualizes loss as a red surface over a gridded landscape, alongside formulas, neural-network diagrams, and training-data examples.
- Color
- Black backgrounds with coral red and orange surfaces, teal grid lines and accents, and white or pale-gray text.
- Type
- Serif headings and body text paired with italic mathematical notation and symbols.
- Framing
- The red loss surface and its vertical loss marker sit above perspective grids; formulas and small diagrams appear beside or near the visualizations, with text examples presented in separate sections.
- Structure
- Connected educational graphics progress from loss-surface illustrations and notation to gradient descent, backpropagation, training data, and the statement “Loss = Information.”