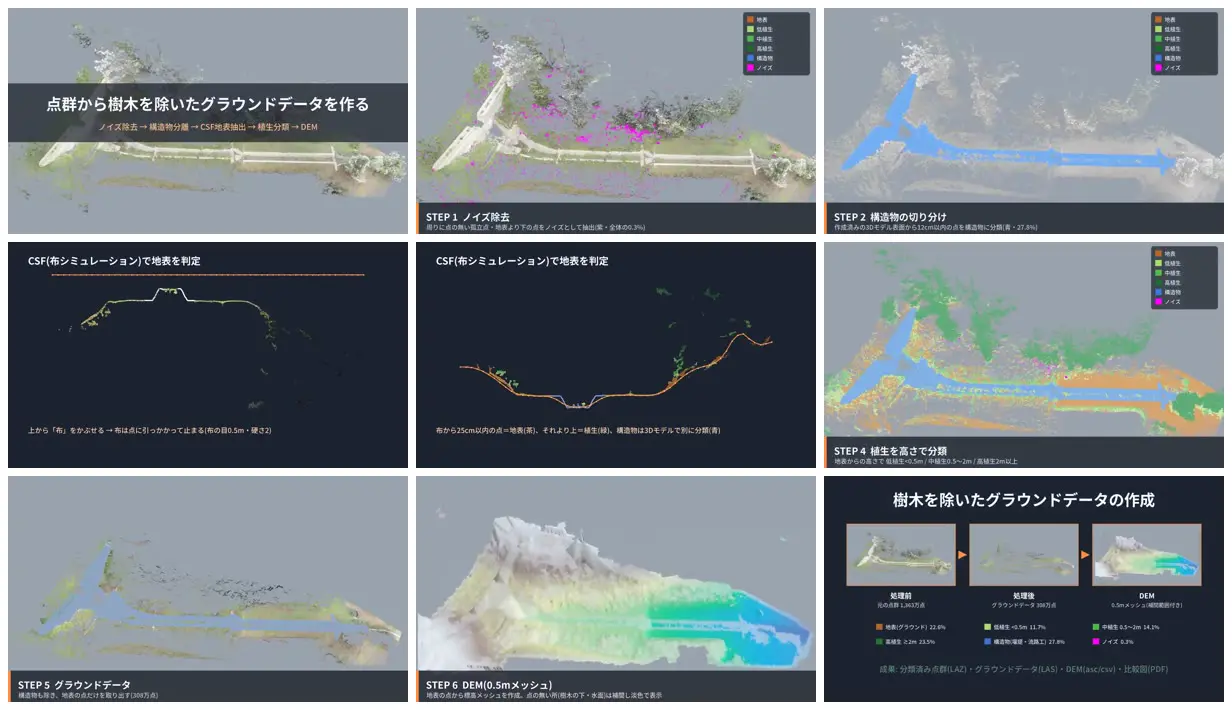
Explain another spatial-data transformation through a consistent series of raw, classified, and reconstructed views. Pair the full dataset with a simple cross section that exposes the filtering principle. Reuse class colors throughout and finish with a compact before-and-after comparison.
No creator prompt published. Reference wrote this brief. Copy for agent includes the brief, visual reference links, and setup guidance.
From point cloud to bare-earth terrain
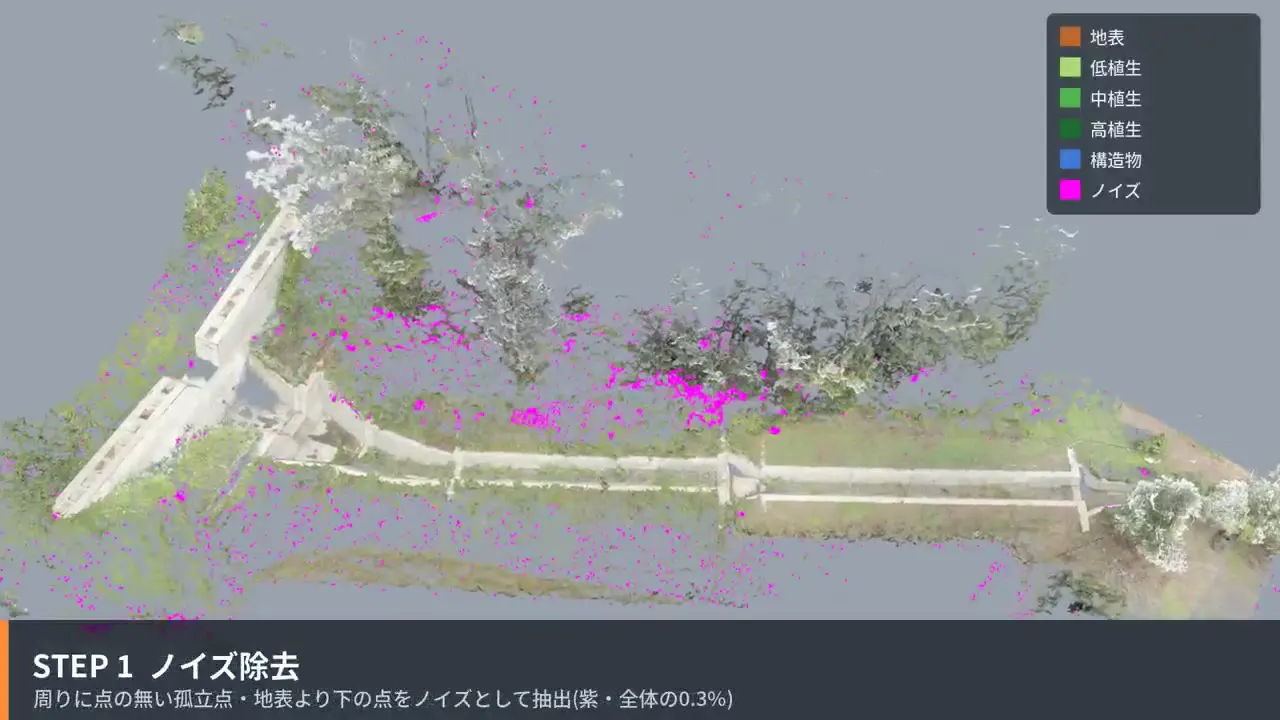
A Japanese technical explainer turns a landscape point cloud into classified ground data and an elevation model, using color-coded classes, cloth-simulation cross sections, and a final before-and-after comparison.
How it was made
Claude Opus 5.5
Source and credit
X · Oct 12, 2026 · 171 likes · 8.2k views · 6 comments
Made with AI, according to the source
Look notesby Reference
Technical presentation graphics illustrating point-cloud terrain processing, ground classification, and DEM output.
- Color
- Muted gray terrain imagery with blue, green, yellow, and magenta data overlays, set against dark navy panels.
- Type
- Clean sans-serif Japanese headings and compact explanatory labels.
- Framing
- Terrain maps and elevation profiles are paired with dark caption bands and a concise workflow diagram.
- Structure
- A sequence of labeled processing stages presents terrain data, ground-separation analysis, height classification, and a colored DEM.