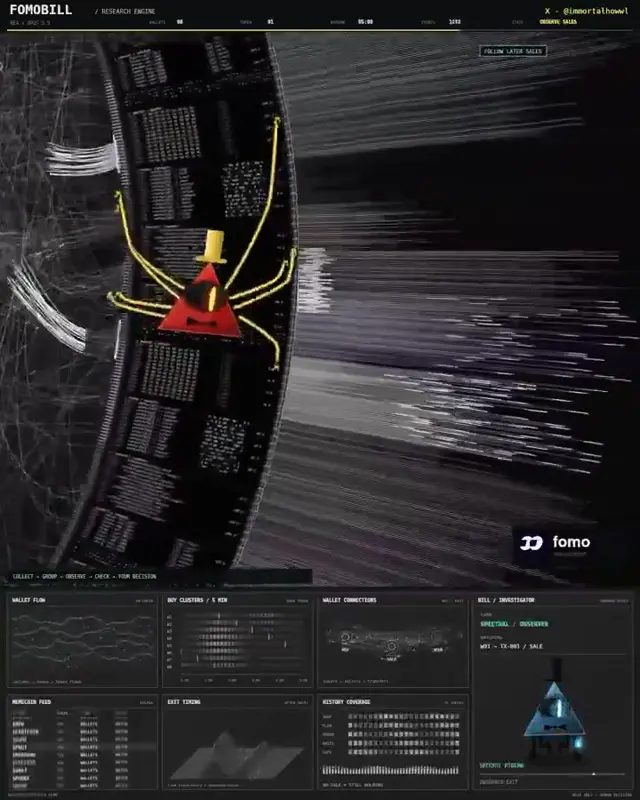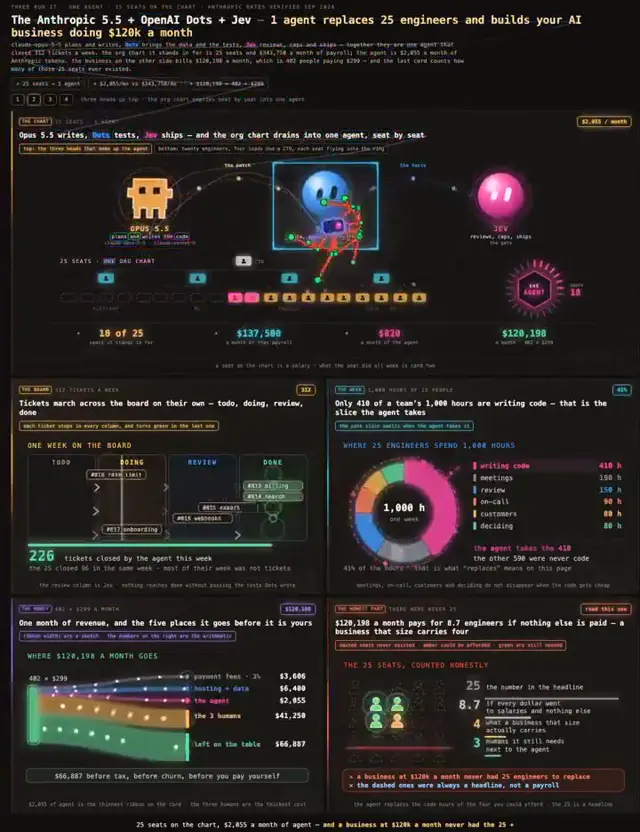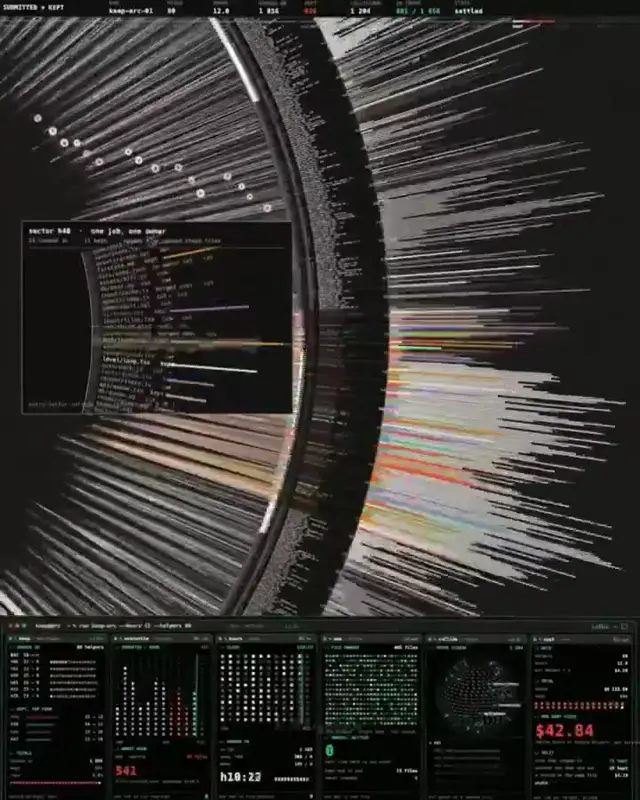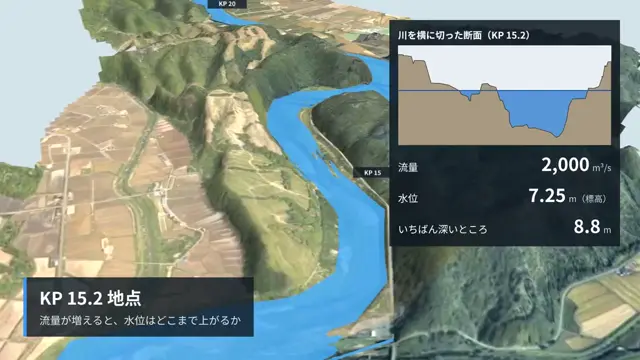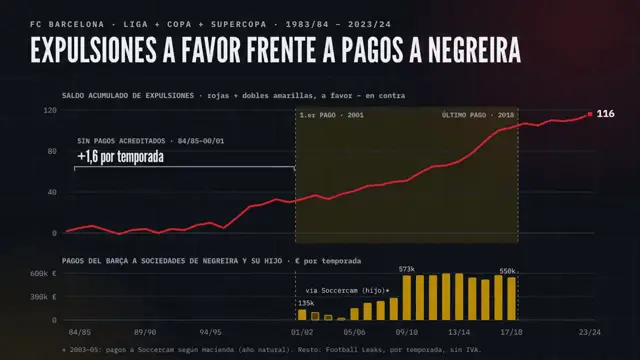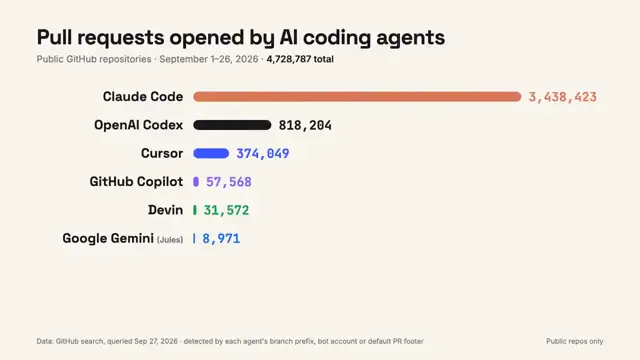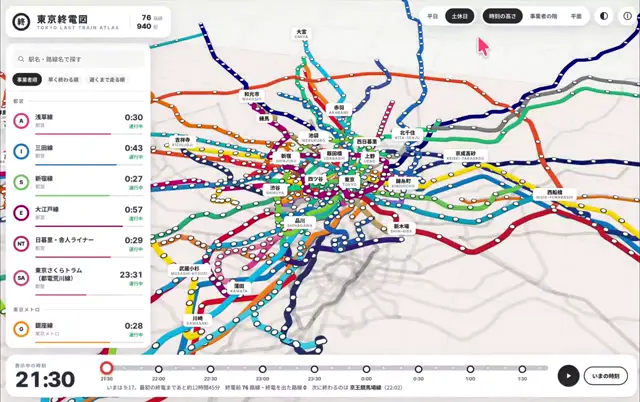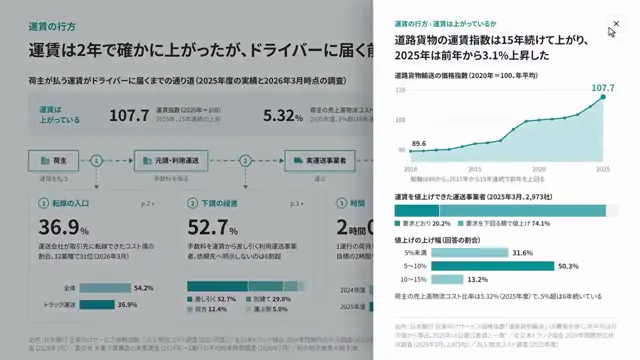
Trading nodes and a profit dashboard
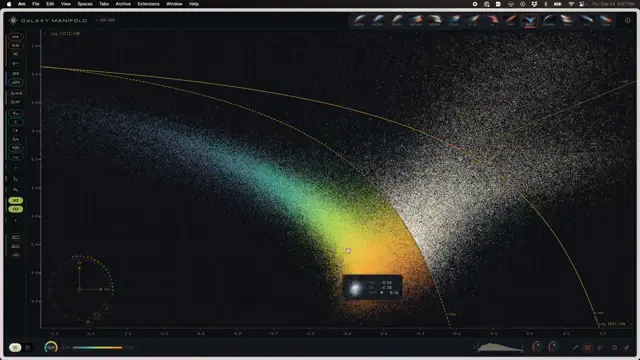
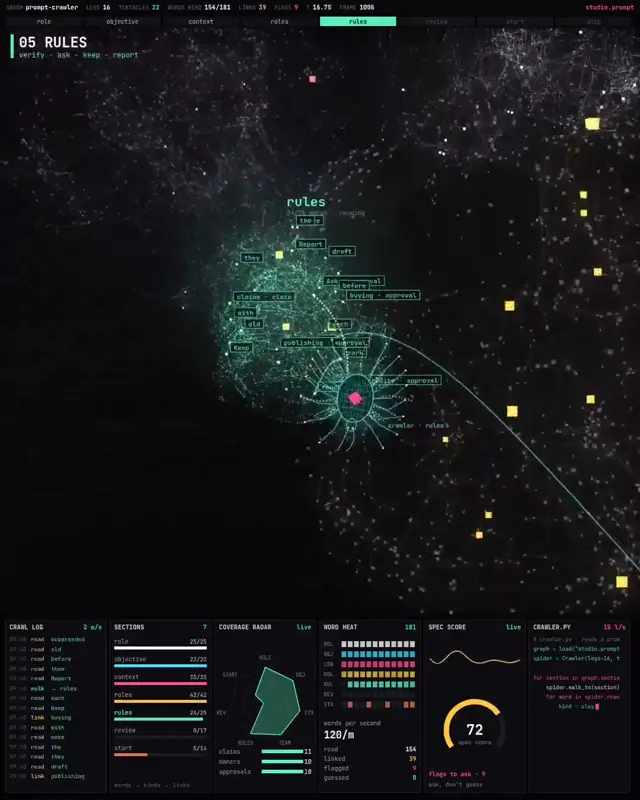
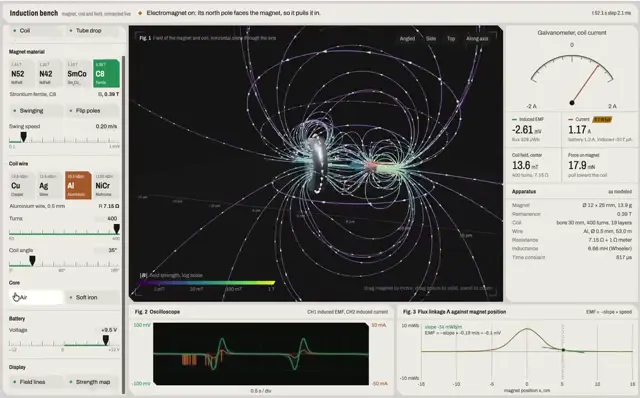
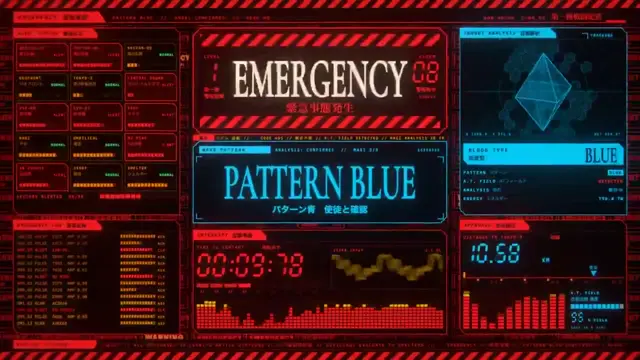
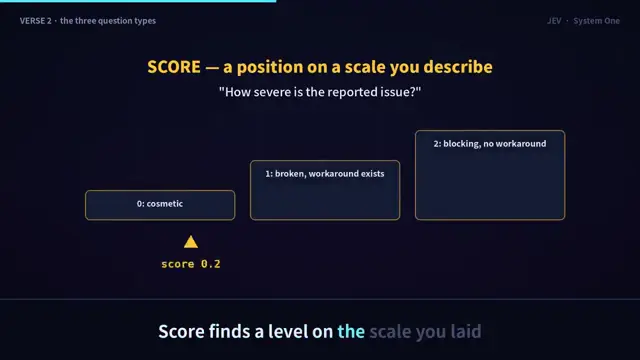
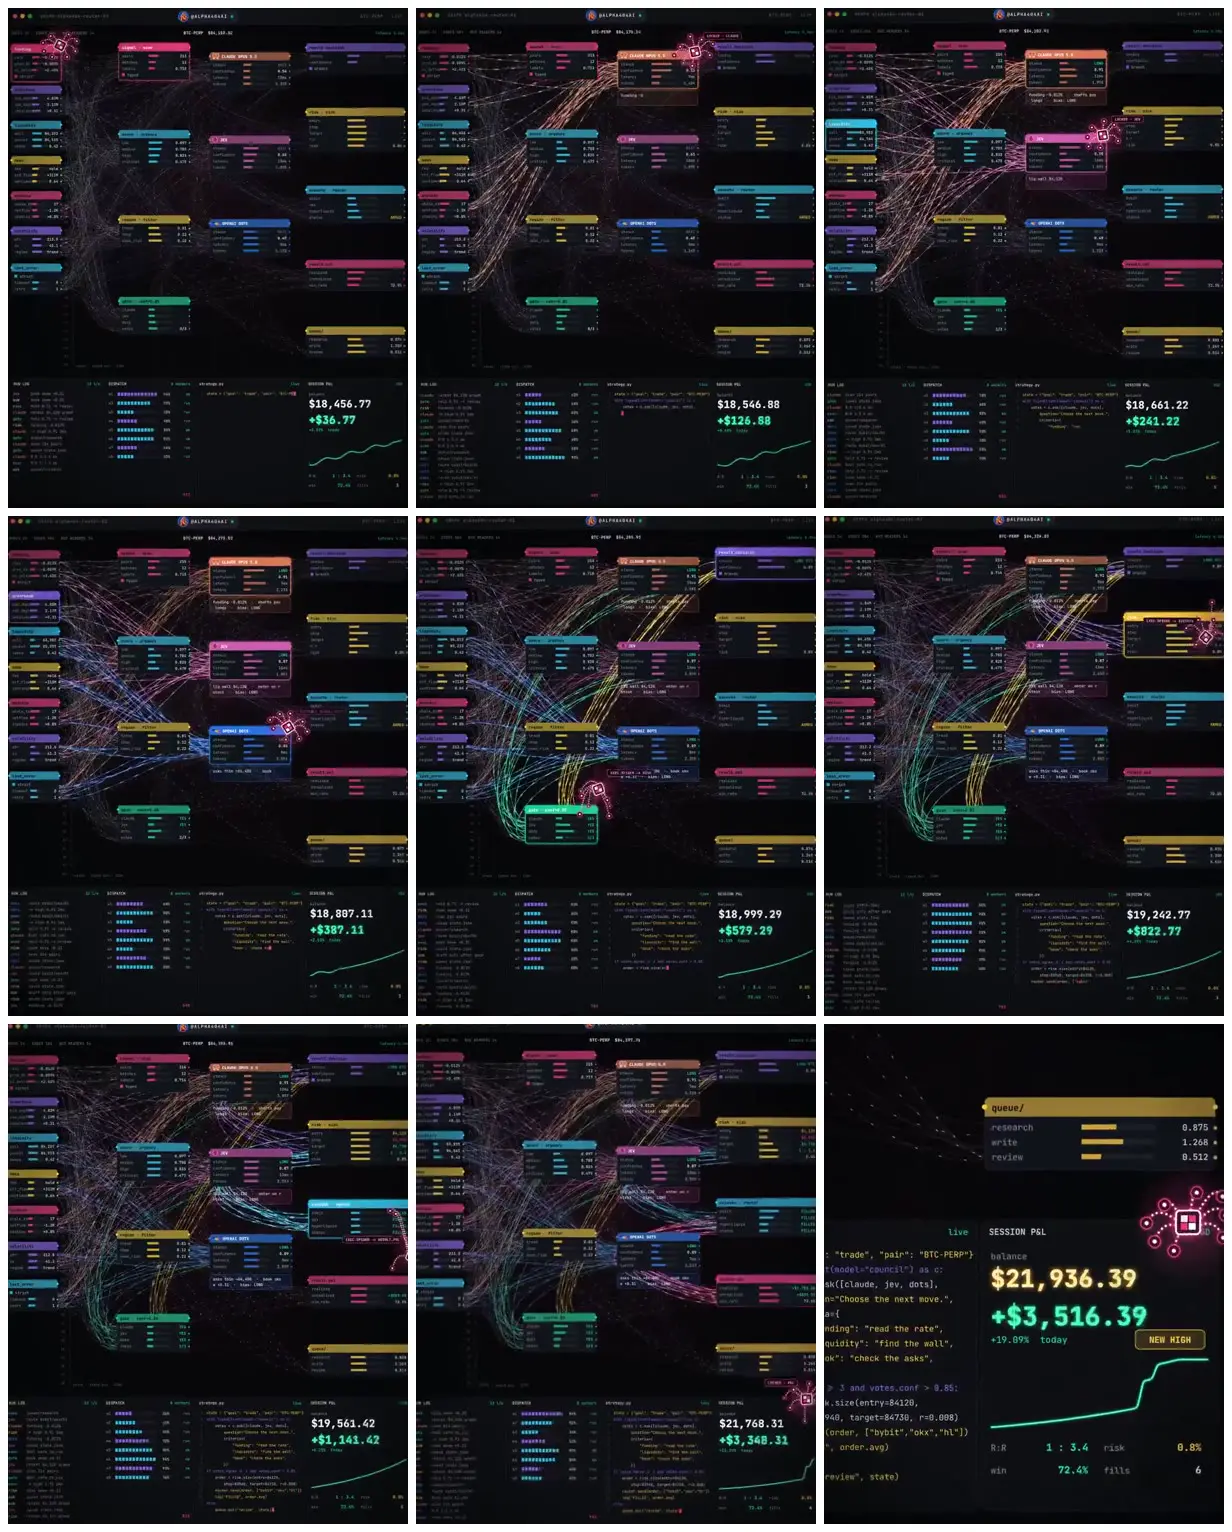
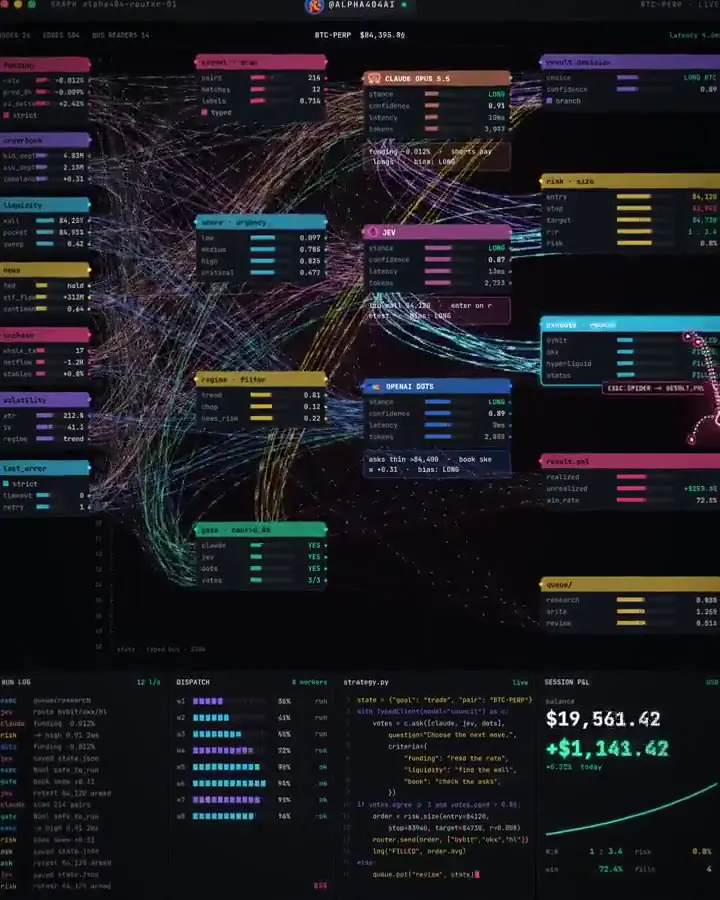
A dark trading dashboard presents colored data nodes linked by dense luminous strands, alongside logs, status bars and a profit chart. A final close-up emphasizes the session balance and result.
Adapt this dashboard language to a supply chain, research pipeline or sensor network. Assign each input class a consistent accent color and connect its compact cards to downstream decision panels. Keep a prominent outcome chart separate from the dense network so the overall result remains readable.
No creator prompt published. Reference wrote this brief. Copy for agent includes the brief, visual reference links, and setup guidance.
Source and credit
X · Oct 6, 2026 · 42 likes · 2k views · 27 comments
Authorship not stated by the source
Look notesby Reference
Dense, futuristic trading interface displaying a connected network of chart-pair panels and trading metrics.
- Color
- Near-black and charcoal backgrounds with neon cyan, teal, magenta, purple, yellow, and green accents.
- Type
- Small, compact sans-serif and monospace text; key prices and profit figures appear larger and bolder.
- Framing
- A broad node-and-connection workspace fills the upper portion, with compact monitoring panels below and a prominent session P&L area at the right.
- Structure
- Numerous color-coded chart-pair cards are linked by fine lines. Lower panels show logs, code-like text, and bar indicators; the right-side trade summary includes a queue, balance, profit figure, and rising line graph.