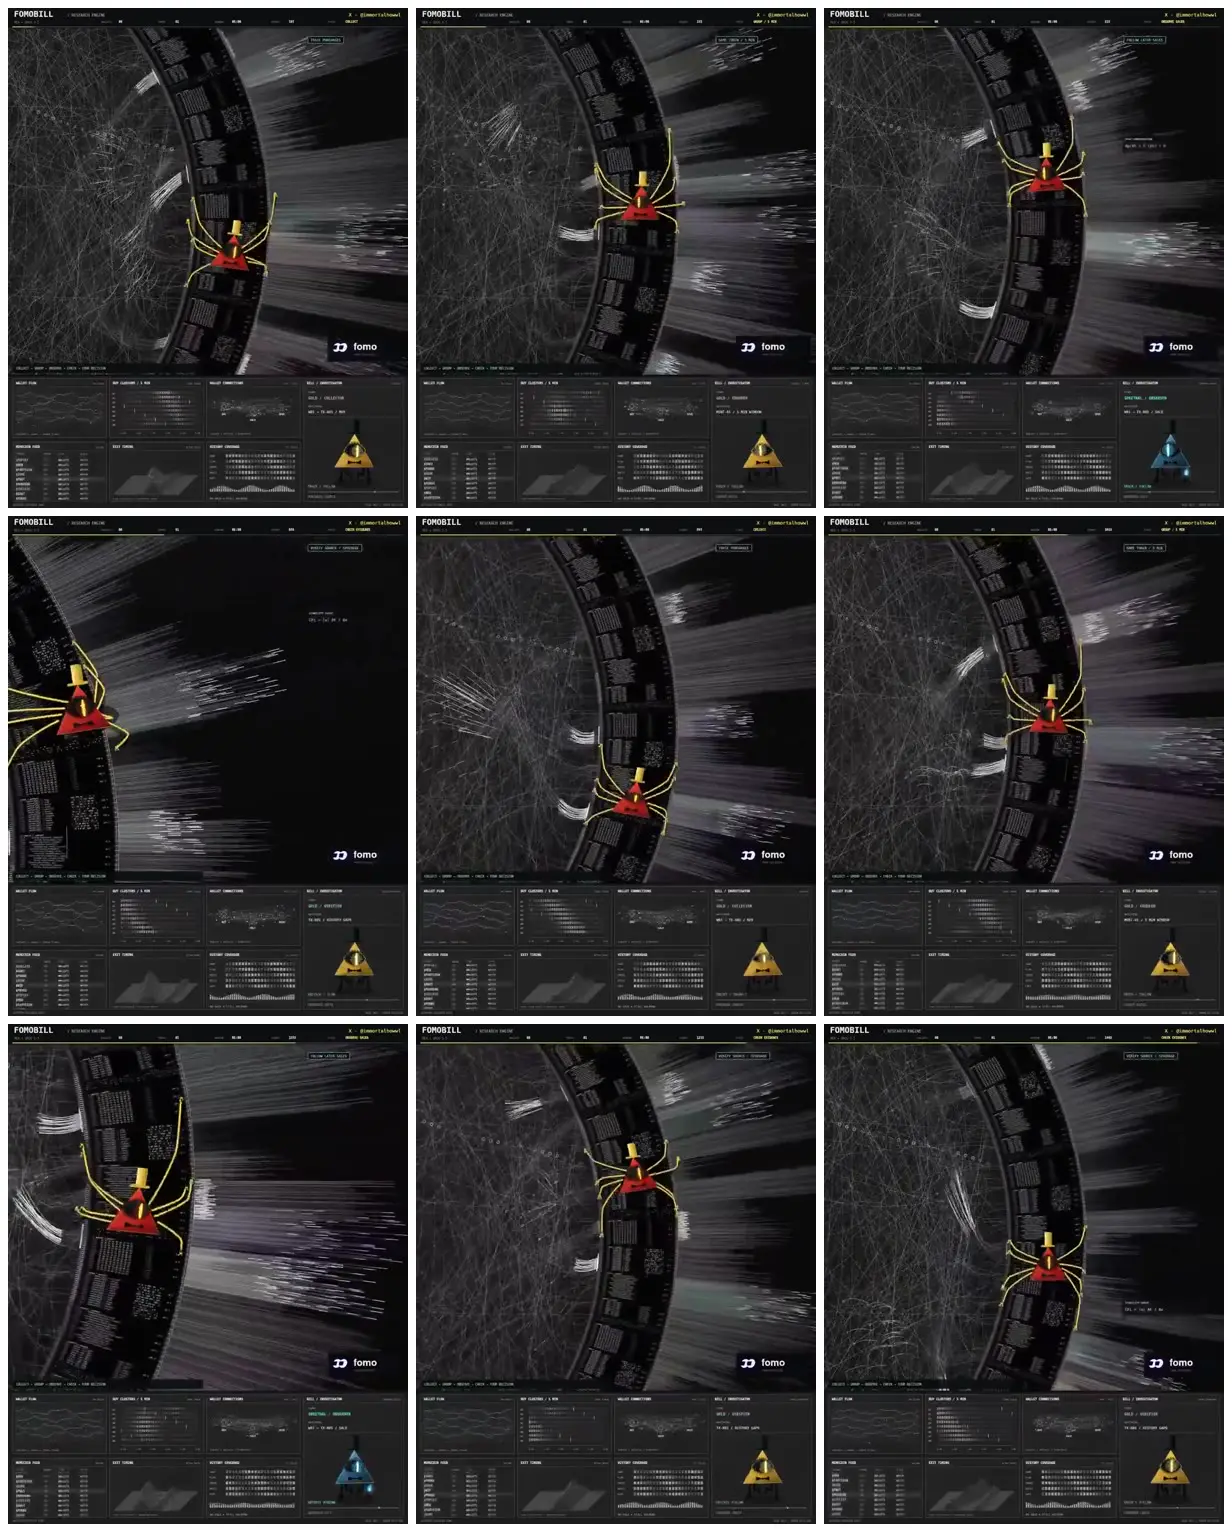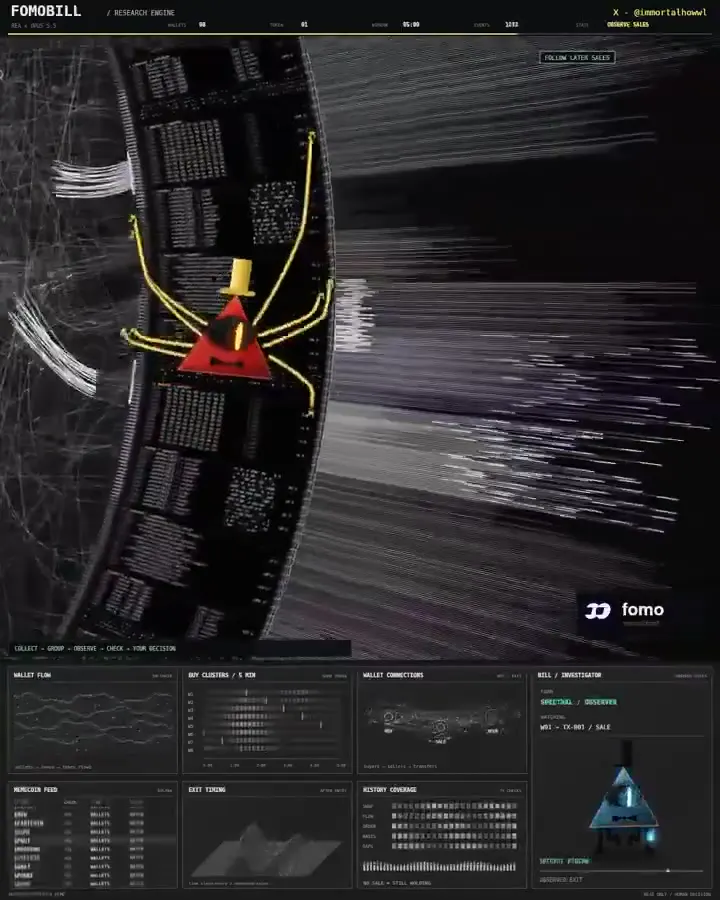
Transaction trails around a curved ledger
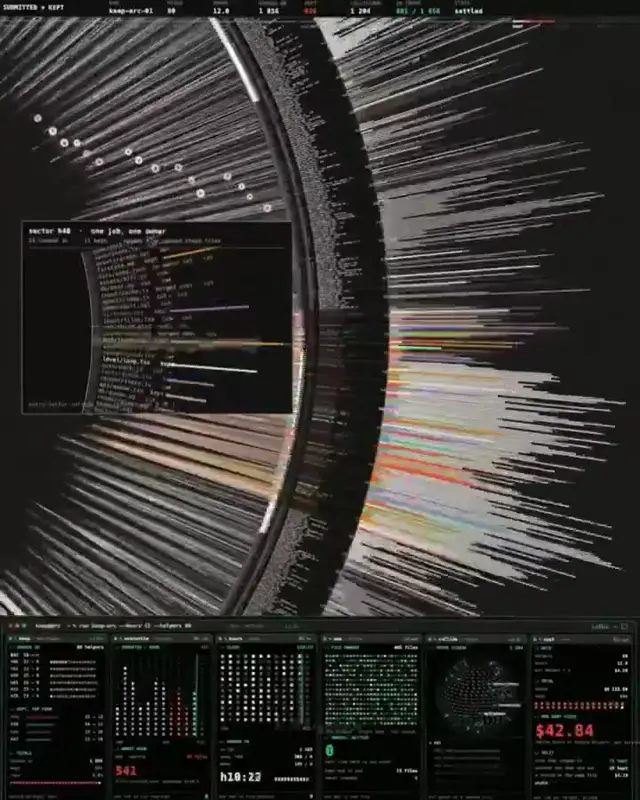
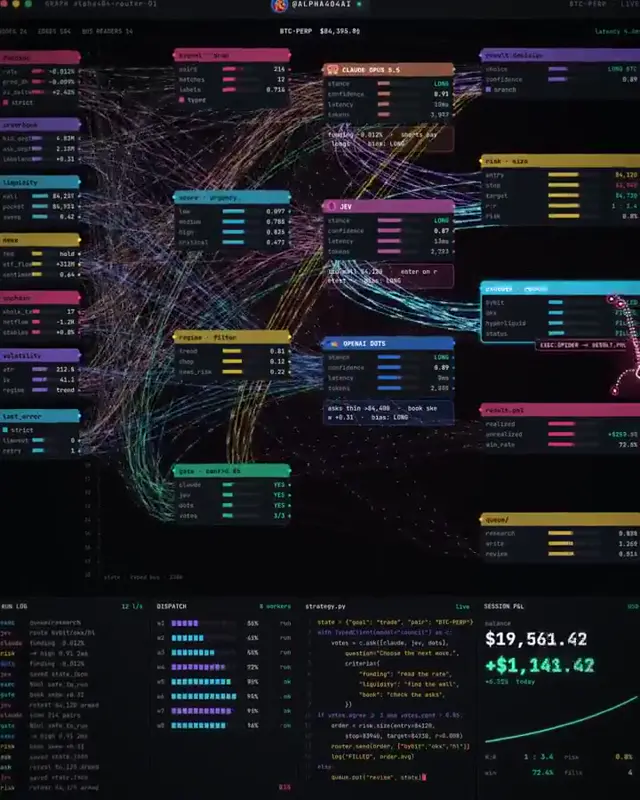
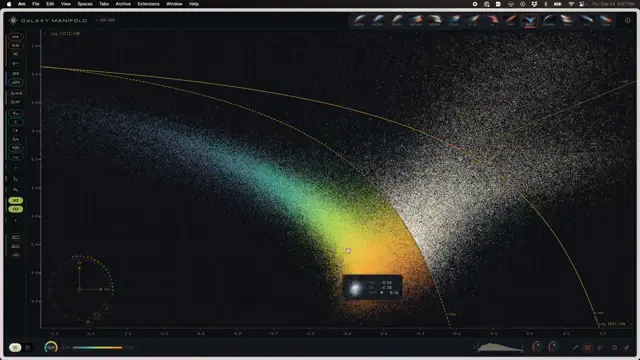
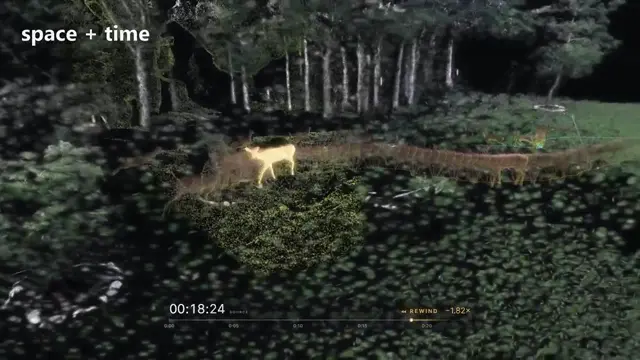
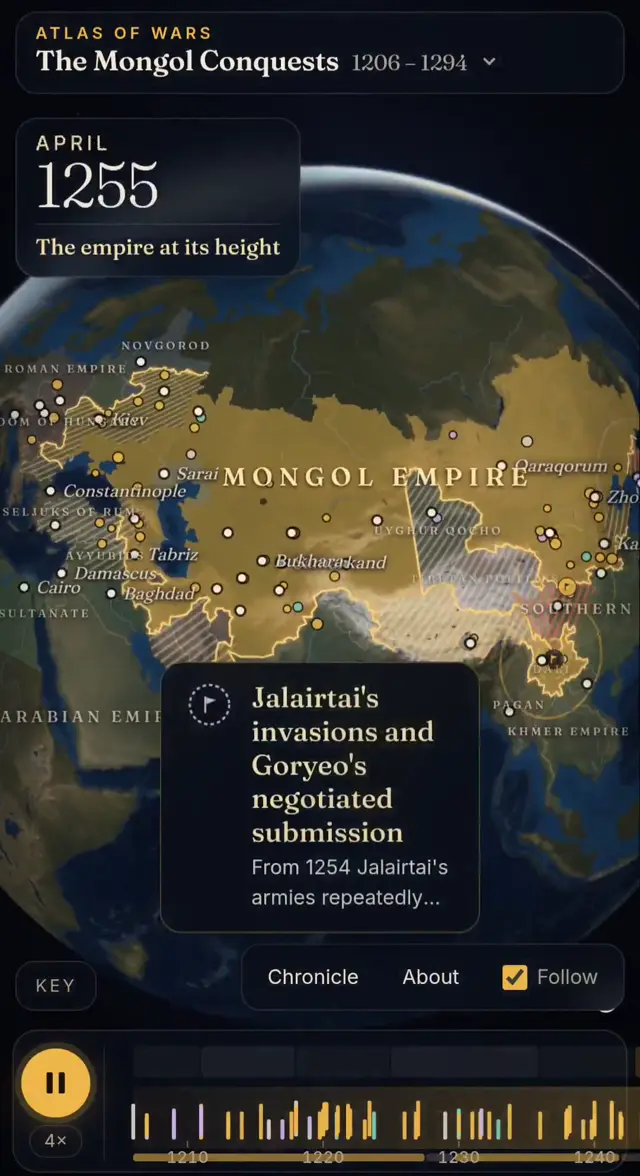
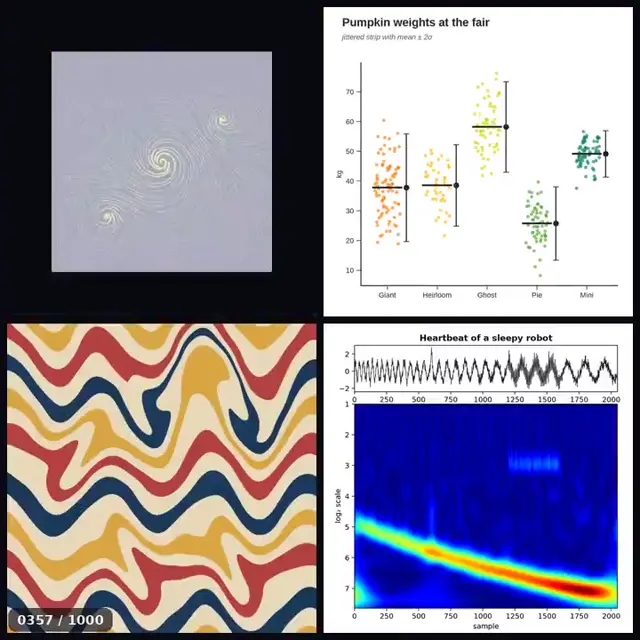
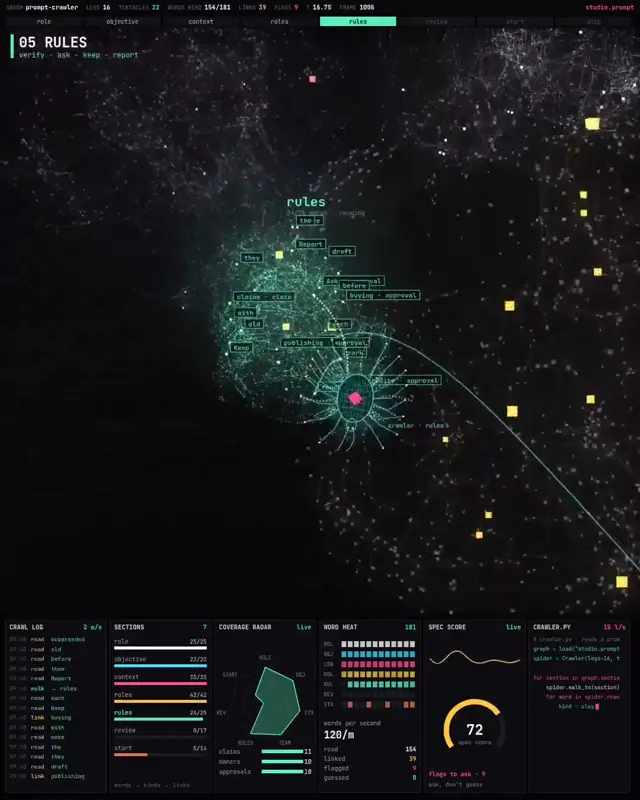
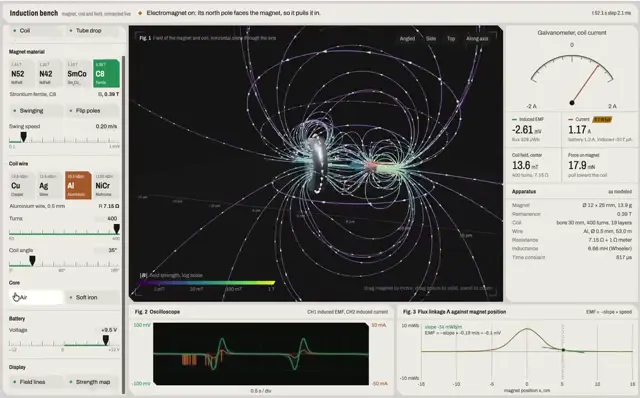
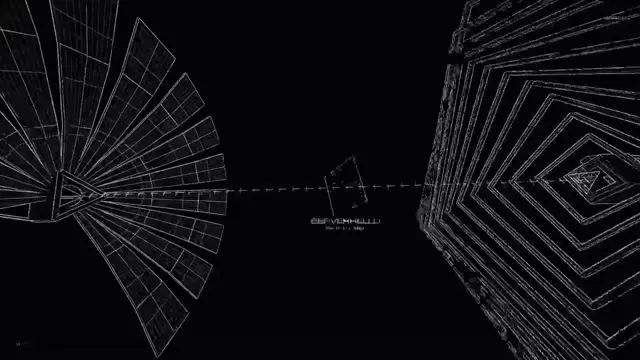
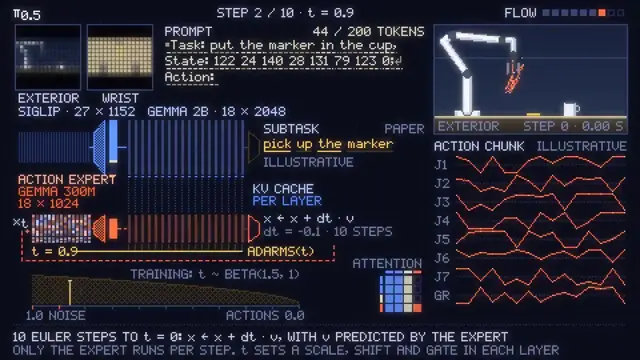
A dark investigation dashboard pairs a sweeping ledger arc with dense white network traces, yellow connections and a red triangular marker. Compact charts and tables form a technical instrument panel beneath the main visualization.
1. Investigate how a selected tool that I am authorized to inspect identifies buys, sales and transfers.

2. Write a specification with source-file references and missing details. Build an independent implementation and tests.

3. Connect public Solana transactions. Group purchases of the same token by watched wallets within a five-minute window, then show each participant’s later observed sales.

4. Link every finding to its transaction. Show incomplete history and errors separately. Never conclude ‘still holding’ just because no sale was found.”
Make it hereFree runs soon
Source and credit
X · Oct 13, 2026 · 126 likes · 7.3k views · 20 comments
Authorship not stated by the source
Published instructions: https://x.com/immortalhowwl/status/2110120519395688758
Look notesby Reference
Futuristic memecoin-trading interface featuring a dense transaction trail, a highlighted central marker, and compact analytics.
- Color
- Near-black and charcoal with muted gray data, lime-yellow connector lines, red highlights, and occasional cyan or gold accents.
- Type
- Small, condensed sans-serif labels and technical-looking data text in a high-density interface.
- Framing
- A large central visualization dominates the screen: branching network lines occupy the left, a curved band of data sits near the middle, and horizontal information blocks fill the right. A grid of smaller analytics panels runs along the bottom.
- Structure
- Thin top navigation bar, expansive transaction visualization, and a bottom strip of boxed charts, tables, and status indicators.