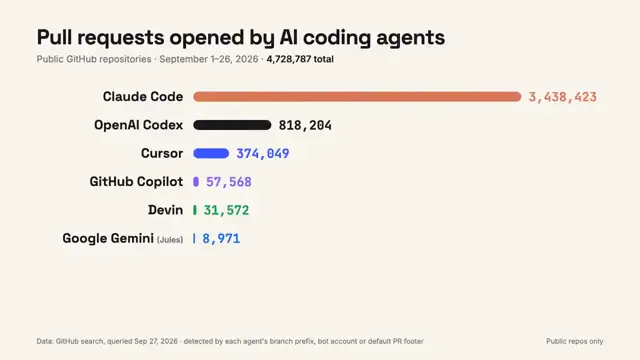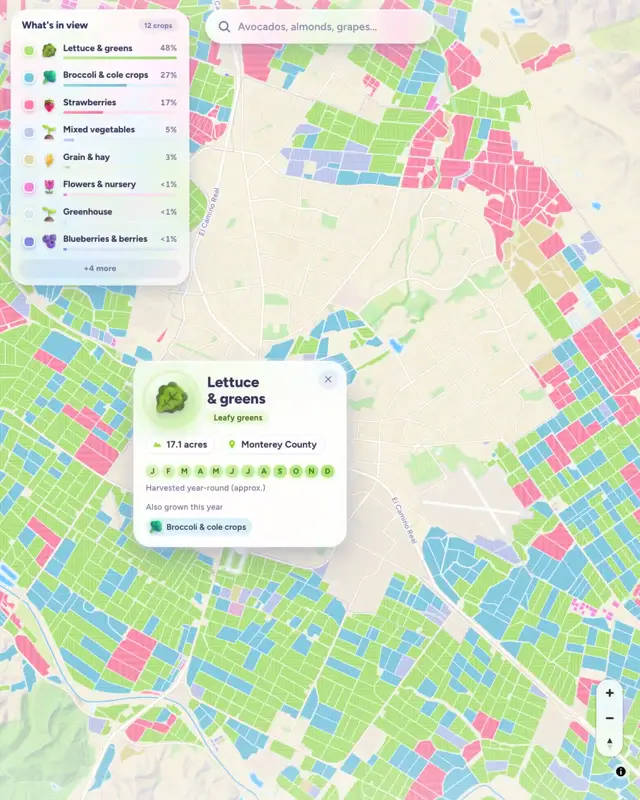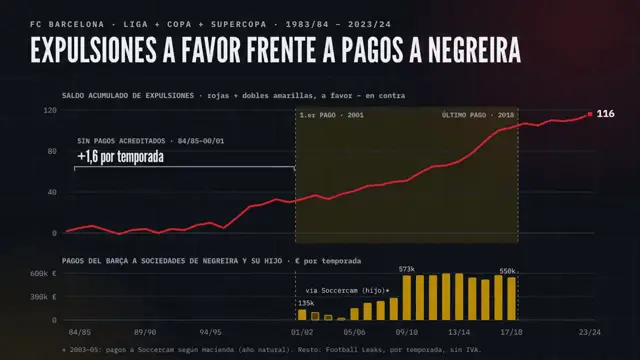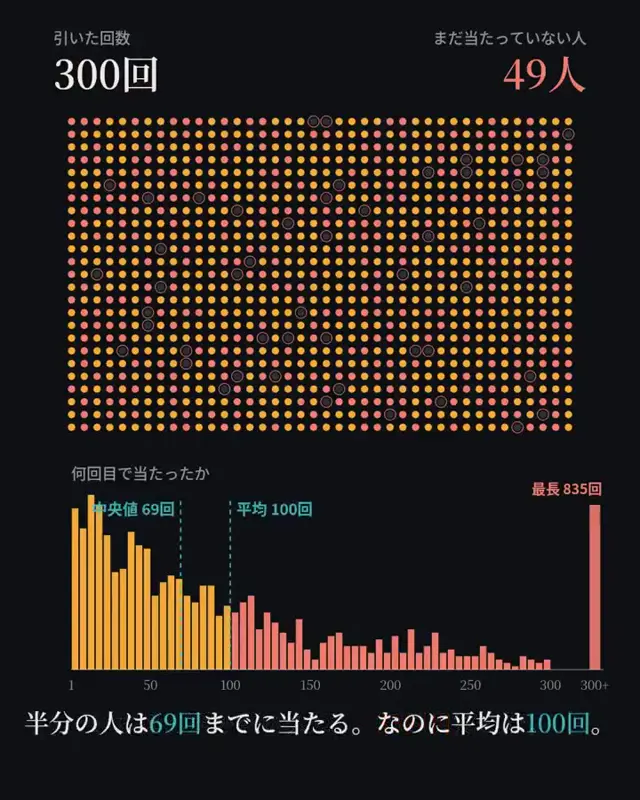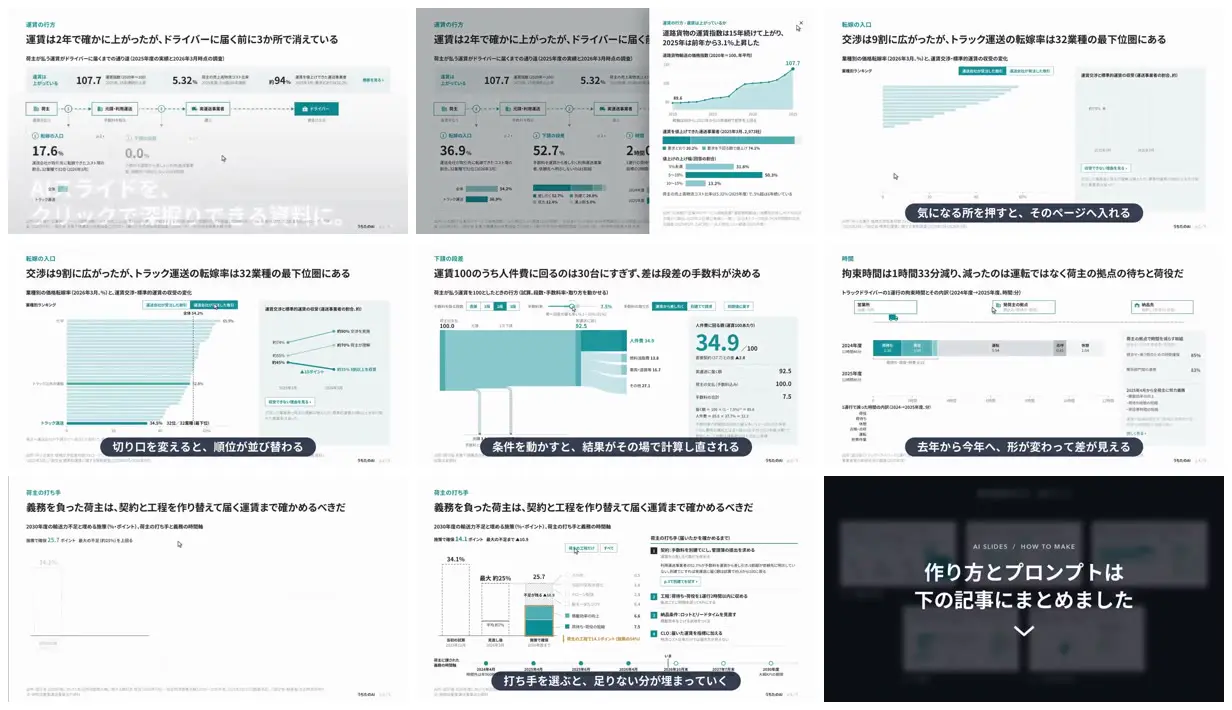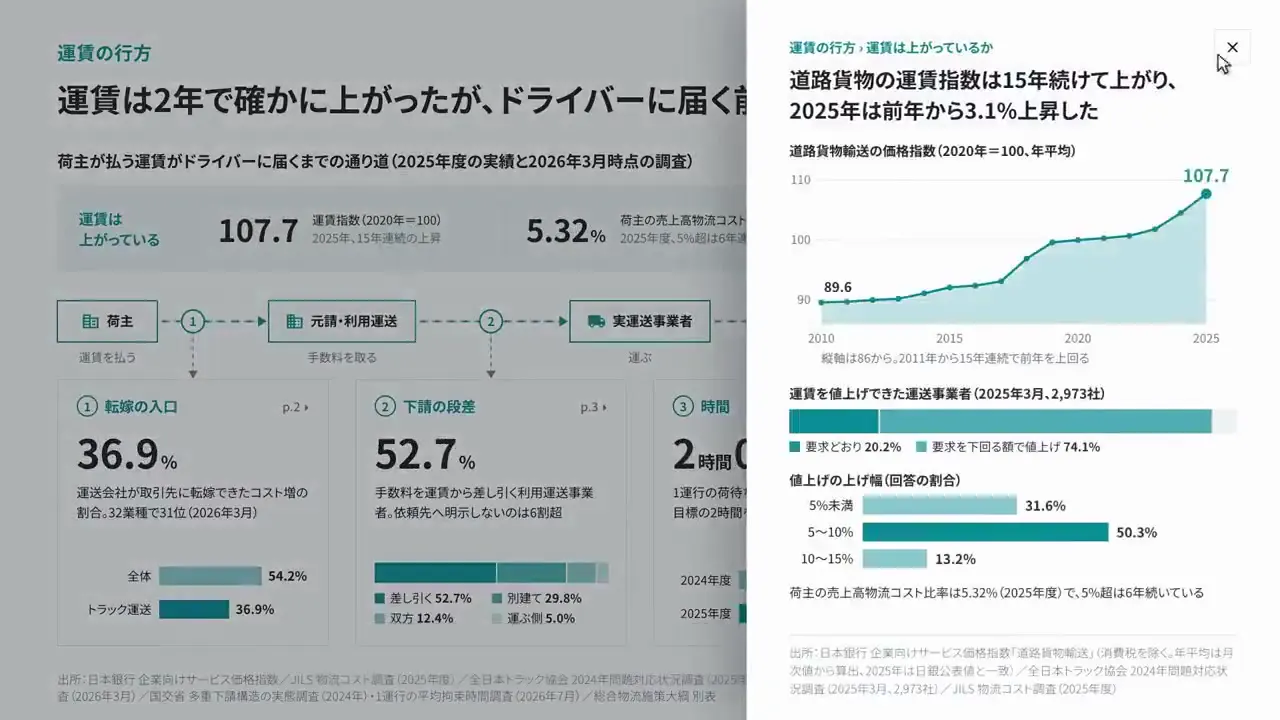
Adapt this system to another operational topic using an argument-led headline and one dominant chart per page. Keep overview metrics, ranked bars, flow diagrams and comparison bars in a shared teal palette, with supporting evidence in pale side panels. Use large numeric callouts to anchor dense material and reserve a consistent bottom strip for sources.
No creator prompt published. Reference wrote this brief. Copy for agent includes the brief, visual reference links, and setup guidance.
Truck freight economics in teal charts
A Japanese presentation examines truck freight economics through headline metrics, ranked bars, revenue flows and time comparisons, with evidence panels and scenario controls integrated into the slide layouts.
Source and credit
X · Sep 26, 2026 · 2.3k likes · 587k views · 29 comments
Authorship not stated by the source
Look notesby Reference
A data-driven presentation about logistics delays, shipment rates, and operational factors, using interactive-looking dashboard panels and evidence callouts.
- Color
- White and pale gray backgrounds with teal, blue-green, and charcoal accents; dark navy title-card background.
- Type
- Japanese sans-serif headings and labels, bold numerical metrics, and compact dashboard text; occasional white text in dark rounded callouts.
- Framing
- Wide presentation slides with prominent headlines, KPI cards, charts, and supporting evidence arranged in clean panels. A dark title card appears among the dashboard slides.
- Structure
- The deck progresses from summary metrics to detailed charts and comparisons, then to operational factors and a concluding title card.