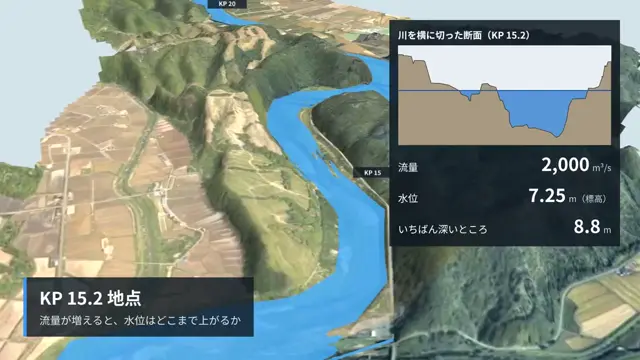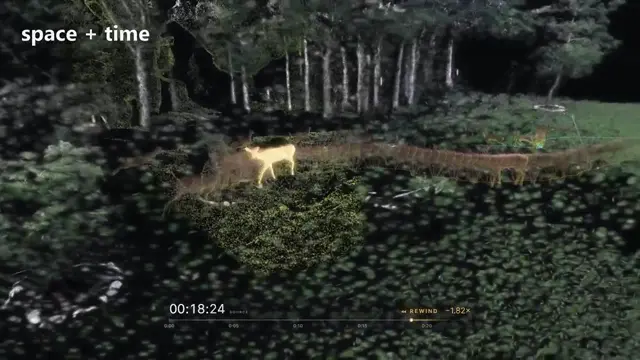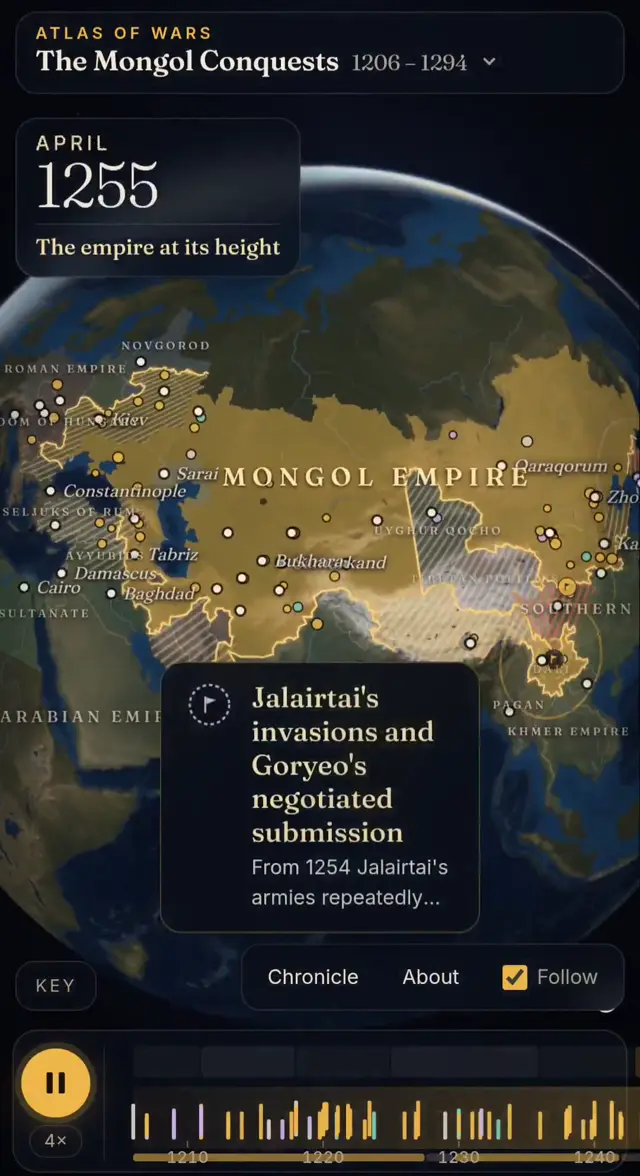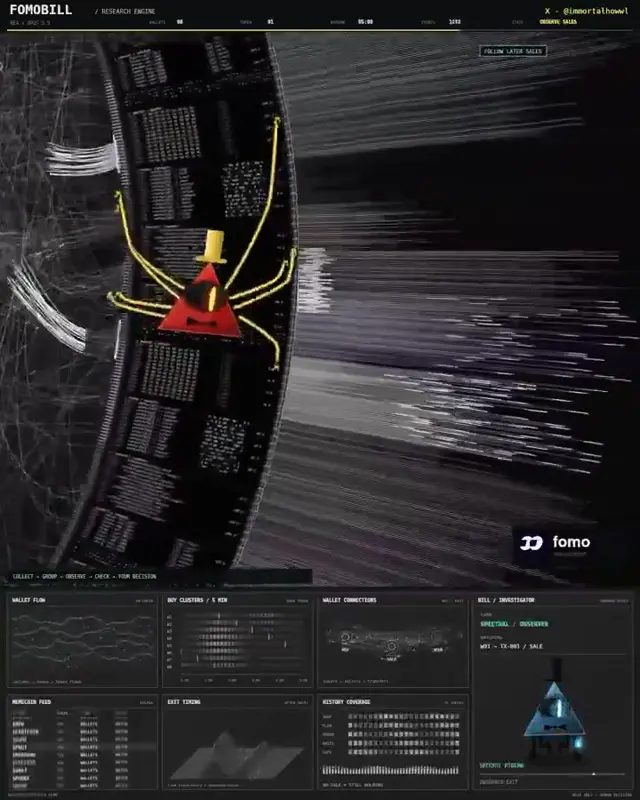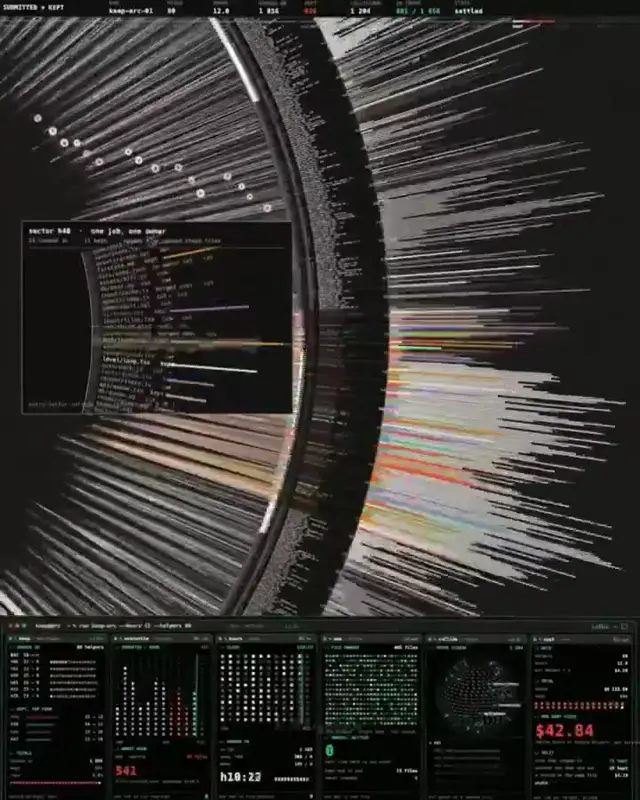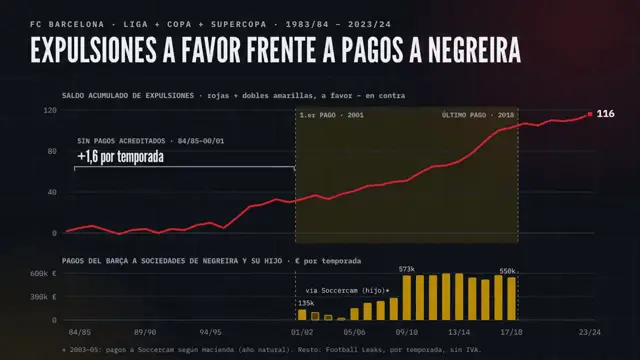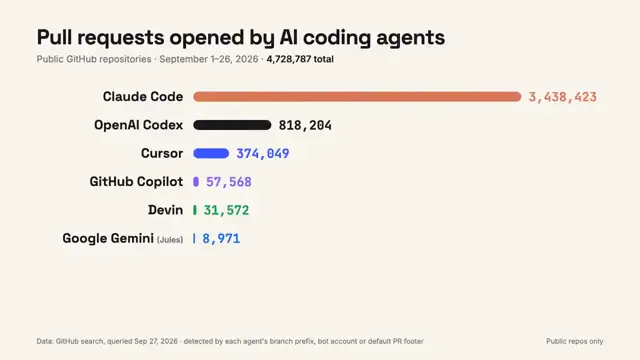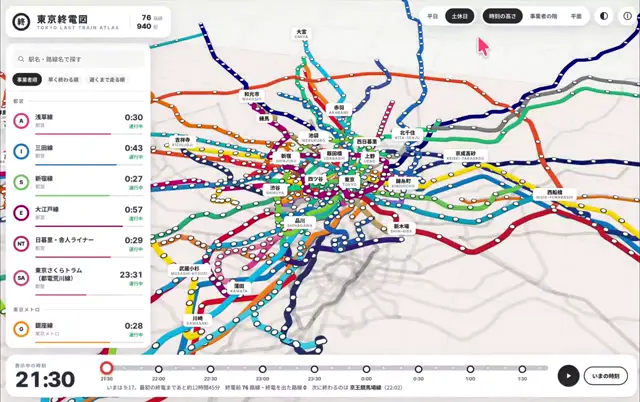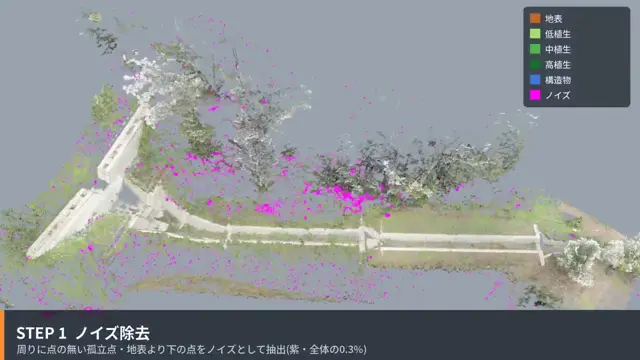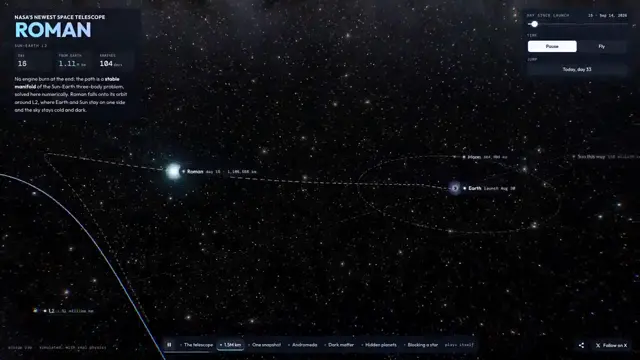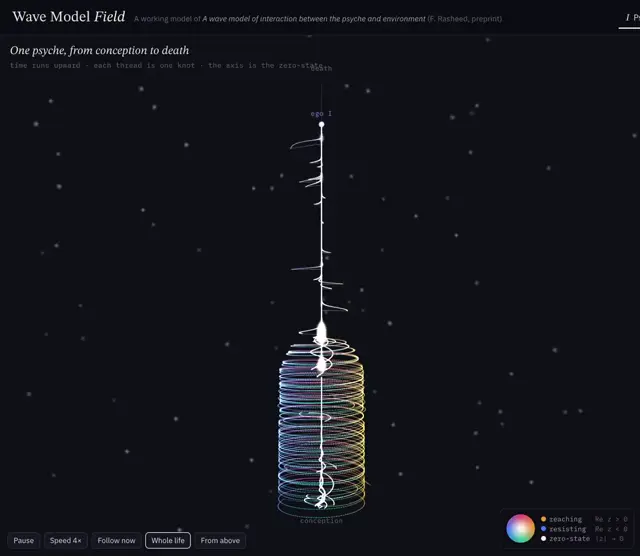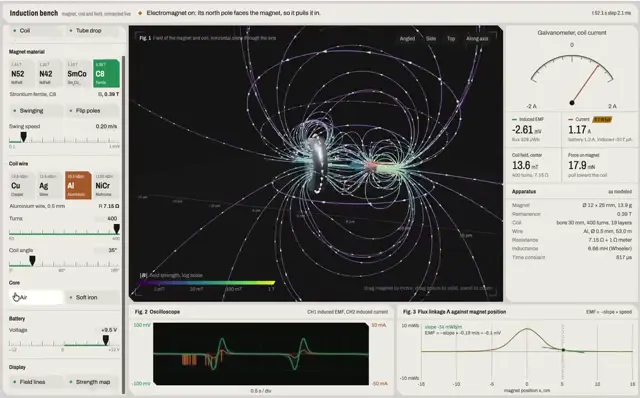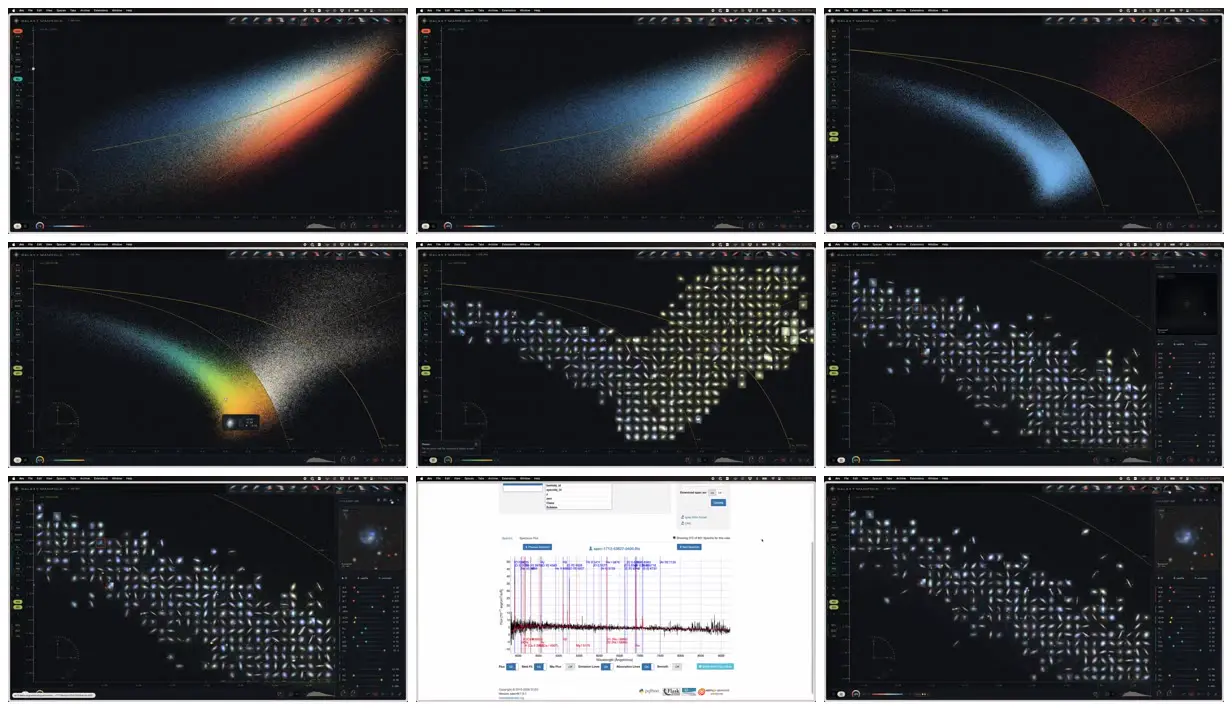
For another scientific collection, pair an aggregate point-cloud view with a plot that uses specimen images as data marks. Keep the background dark and controls visually quiet so the distribution remains dominant. Add a compact inspection panel that connects a selected mark to its image and measurements.
No creator prompt published. Reference wrote this brief. Copy for agent includes the brief, visual reference links, and setup guidance.
Galaxy clouds and thumbnail plots
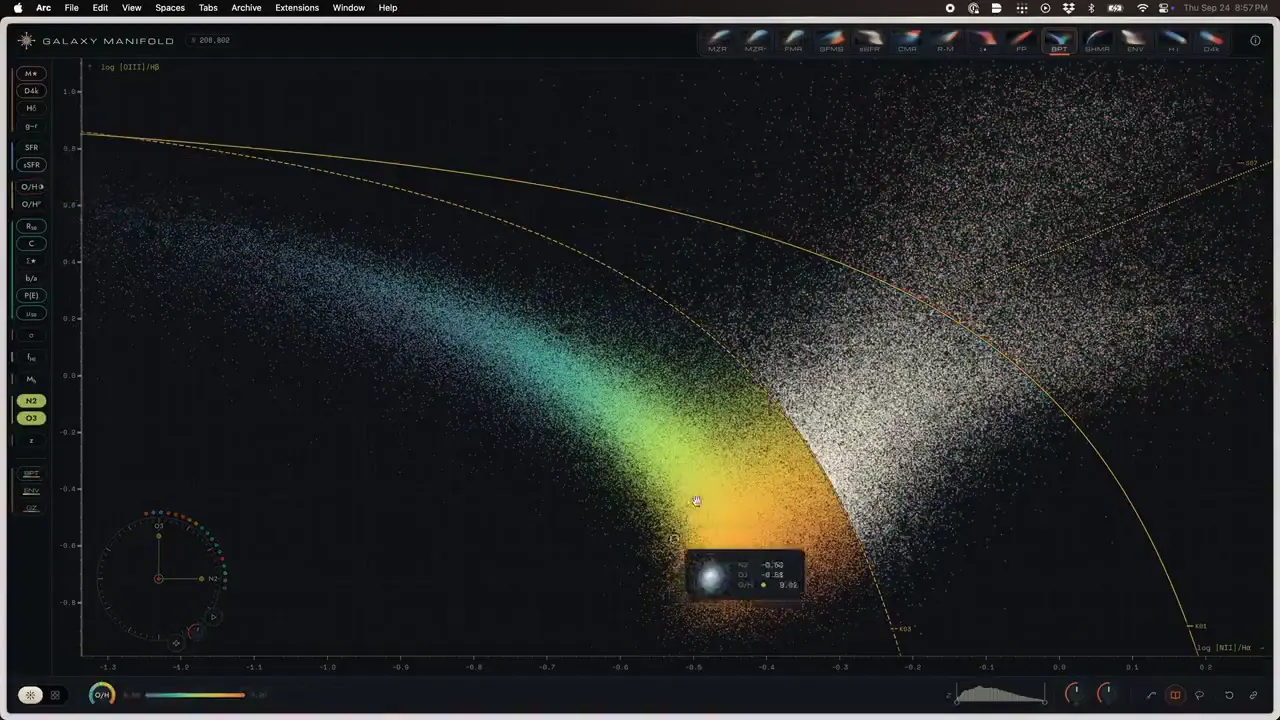
A dark astronomy interface presents luminous galaxy point clouds, curved guide lines, and plots composed of galaxy thumbnails. Selected objects appear beside compact inspection panels.
How it was made
Reference shows a muted excerpt from 0:42 to 2:12. Watch the complete video at the original source.
Opus 5.5
Source and credit
X · Sep 25, 2026 · 338 likes · 29k views · 8 comments
Made with AI, according to the source
Look notesby Reference
Dark scientific interface displaying colorful galaxy-density plots and clusters of luminous data points.
- Color
- Near-black and navy backgrounds with cyan, blue, white, yellow, orange, and red plot highlights.
- Type
- Compact, small sans-serif interface labels and controls; most text is too small to read.
- Framing
- Plot areas dominate the screens, with slim toolbars and side controls around them. Some views show diagonal color gradients or curved boundaries; others show scattered, grid-like points.
- Structure
- Multiple interface views present different plot styles, including continuous density fields, curved data regions, and sparse-to-dense point distributions.